Whitehead (1997) describes a sequential trial by two statistics:
In the notation of this tutorial, \(V = I\) and \(Z = \hat\theta\, I\), the score statistic \(S\) of Information. The standardised statistic is \(Z/\sqrt V\). Under the canonical distribution, \(Z\) is a Brownian motion in “time” \(V\) with drift \(\theta\). Straight lines on this plane are therefore natural boundaries (Whitehead and Jones 1979; Whitehead 1999).
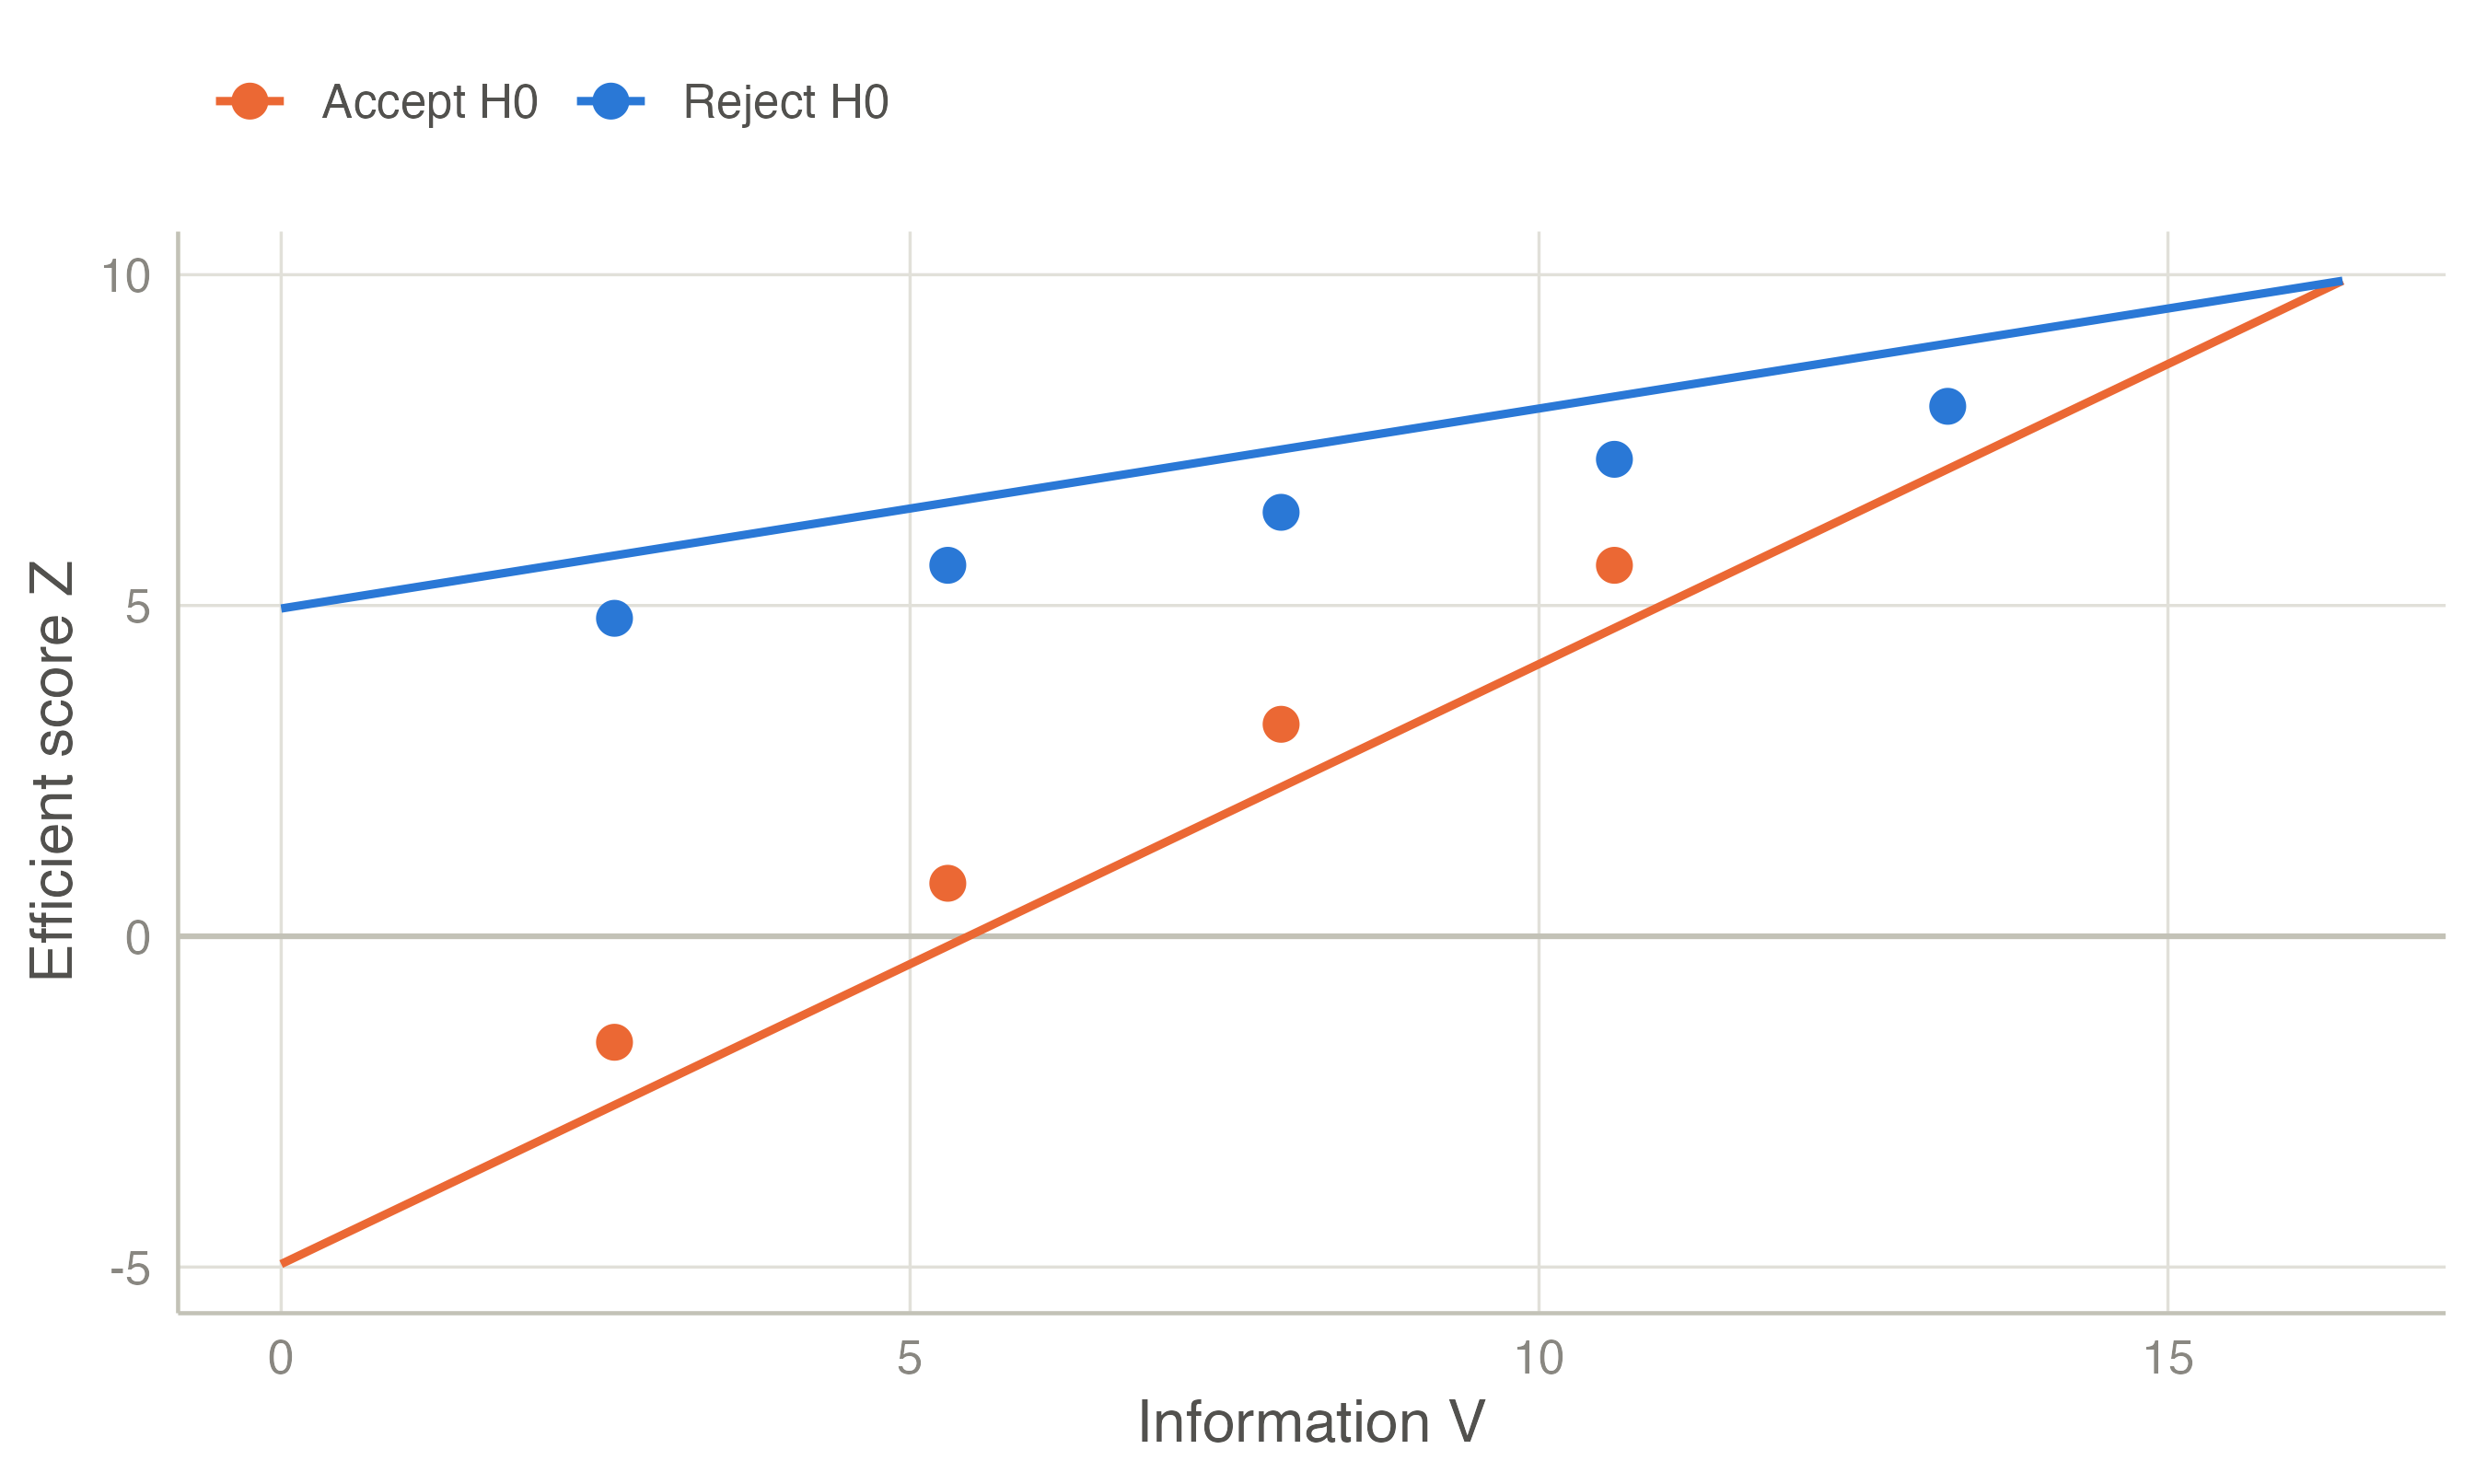
For a one-sided test of \(H_0\!: \theta \le 0\) against \(\theta = \theta_1 > 0\), with type I error \(\alpha\) and power \(1-\beta\), the triangular test continues while
\[ -a + 3cV \;<\; Z \;<\; a + cV , \]
rejecting \(H_0\) above the upper line and accepting it below the lower one. With \(k = 1 + z_{1-\beta}/z_{1-\alpha}\),
\[ a = \frac{k \,\ln\!\big(1/(2\alpha)\big)}{\theta_1}, \qquad c = \frac{\theta_1}{2k}. \]
When \(\alpha = \beta\) these reduce to \(a = 2\ln(1/(2\alpha))/\theta_1\) and \(c = \theta_1/4\). The two lines meet at \(V_{\max} = a/c\), so the test is closed: it can never run beyond \(V_{\max}\). Among tests with the same error rates, it nearly minimises the maximum expected sample size (Whitehead and Stratton 1983; Jennison and Turnbull 2000).
Discrete looks. The formulas assume continuous monitoring. When the data are examined only at looks \(V_1 < V_2 < \dots\), a path can jump over a boundary between looks. The “Christmas-tree” correction pulls both boundaries in by \(0.583\sqrt{V_k - V_{k-1}}\) at look \(k\) (Whitehead 1997). The corrected boundaries therefore meet before the apex of the original triangle. jmsequential chooses the maximum information so that they meet exactly at the last planned look, as SAS PROC SEQDESIGN does, so every planned look can be reached. At that look, \(H_0\) is rejected if \(Z \ge 2cV\).
Two-sided alternative. The double triangular test joins two triangles, one for each sign of \(\theta\), each at level \(\alpha/2\). The region where both close becomes an inner wedge in which the trial stops with “no difference”.
jmsequential computes the boundaries from these formulas, then reports the exact attained \(\alpha\) and power from its numerical engine, because the formulas are approximations.
| Design | Attained alpha | Power | Max n | E n | H0 | E n | H1 |
|---|---|---|---|---|---|
| Triangular, 5 looks | 0.0253 | 0.9021 | 1.2609 | 0.5822 | 0.6802 |
| Triangular, 10 looks | 0.0251 | 0.9024 | 1.3418 | 0.5453 | 0.6457 |
| Triangular, 20 looks | 0.0250 | 0.9025 | 1.4022 | 0.5257 | 0.6273 |
| LD O’Brien-Fleming, 10 looks | 0.0250 | 0.9000 | 1.0355 | 1.0310 | 0.7223 |
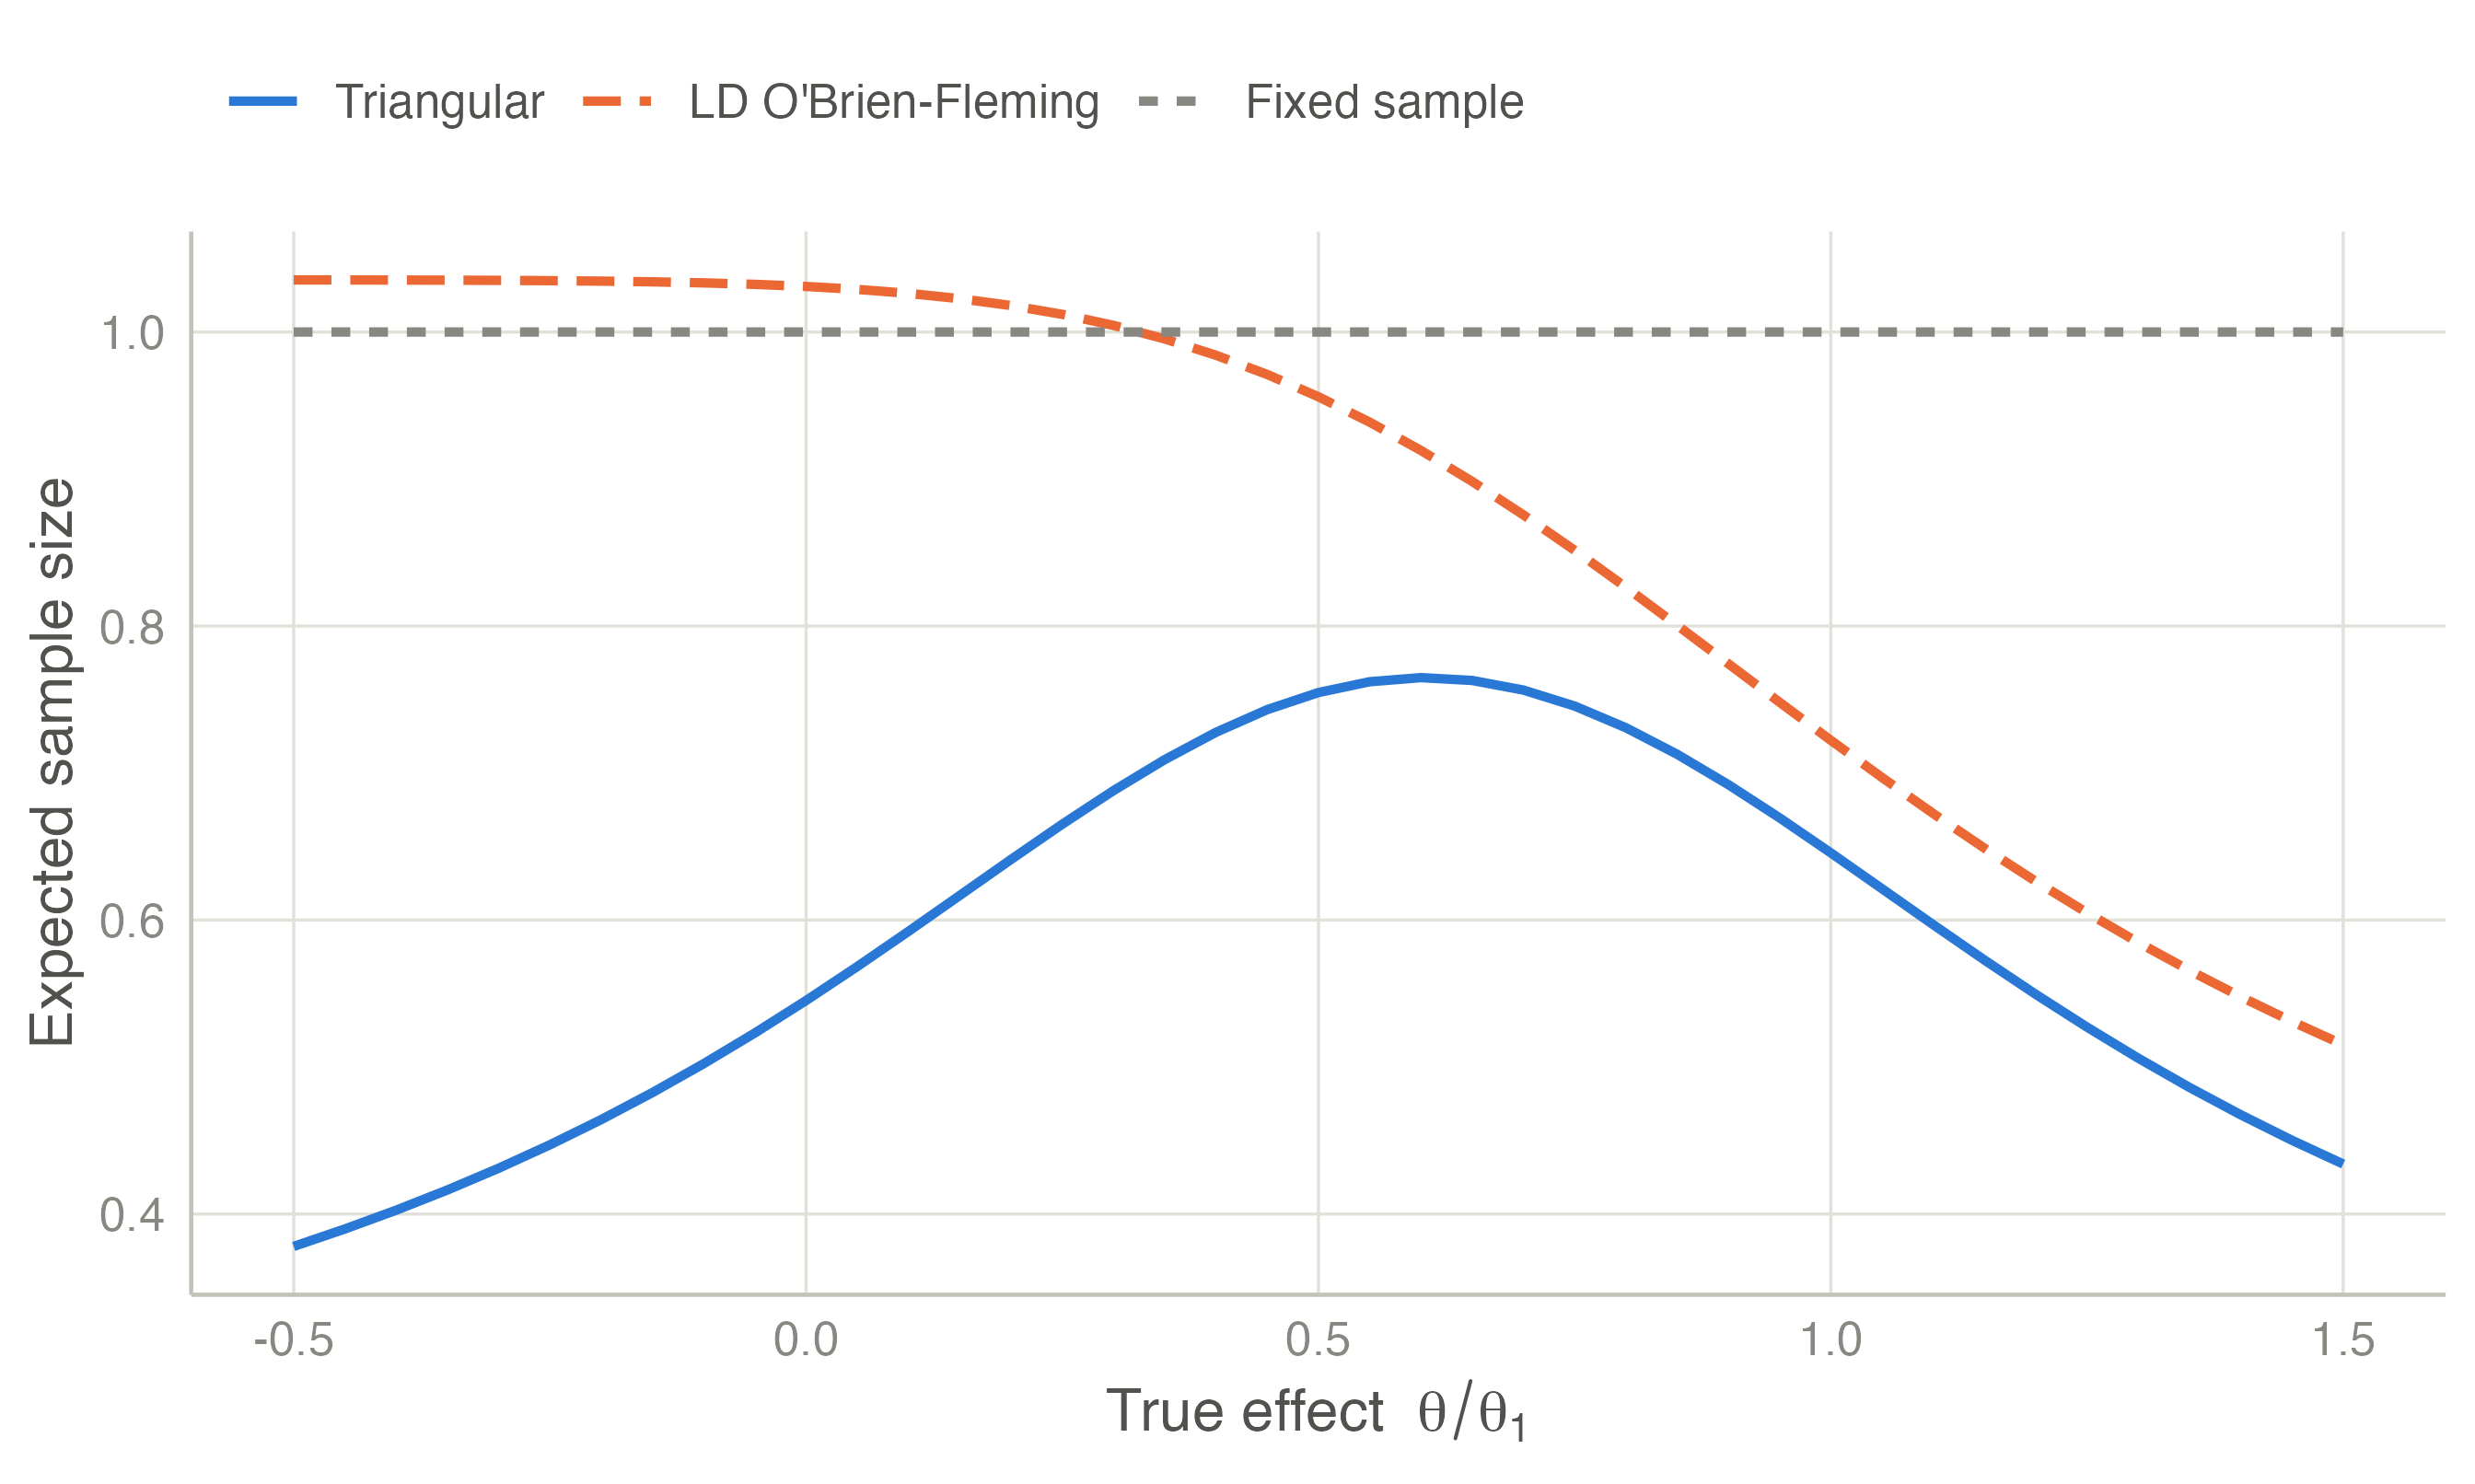
The triangular test needs a larger maximum sample size than O’Brien–Fleming, and more so the more often it looks. In exchange it stops much earlier on average under both hypotheses, especially under \(H_0\), where the O’Brien–Fleming design has no futility boundary. The attained \(\alpha\) and power are close to their targets, and closer as looks become more frequent.
Triangular tests are available in SAS PROC SEQDESIGN and PEST. In psychology they have been popularised by the R package seqtest (Yanagida 2017).
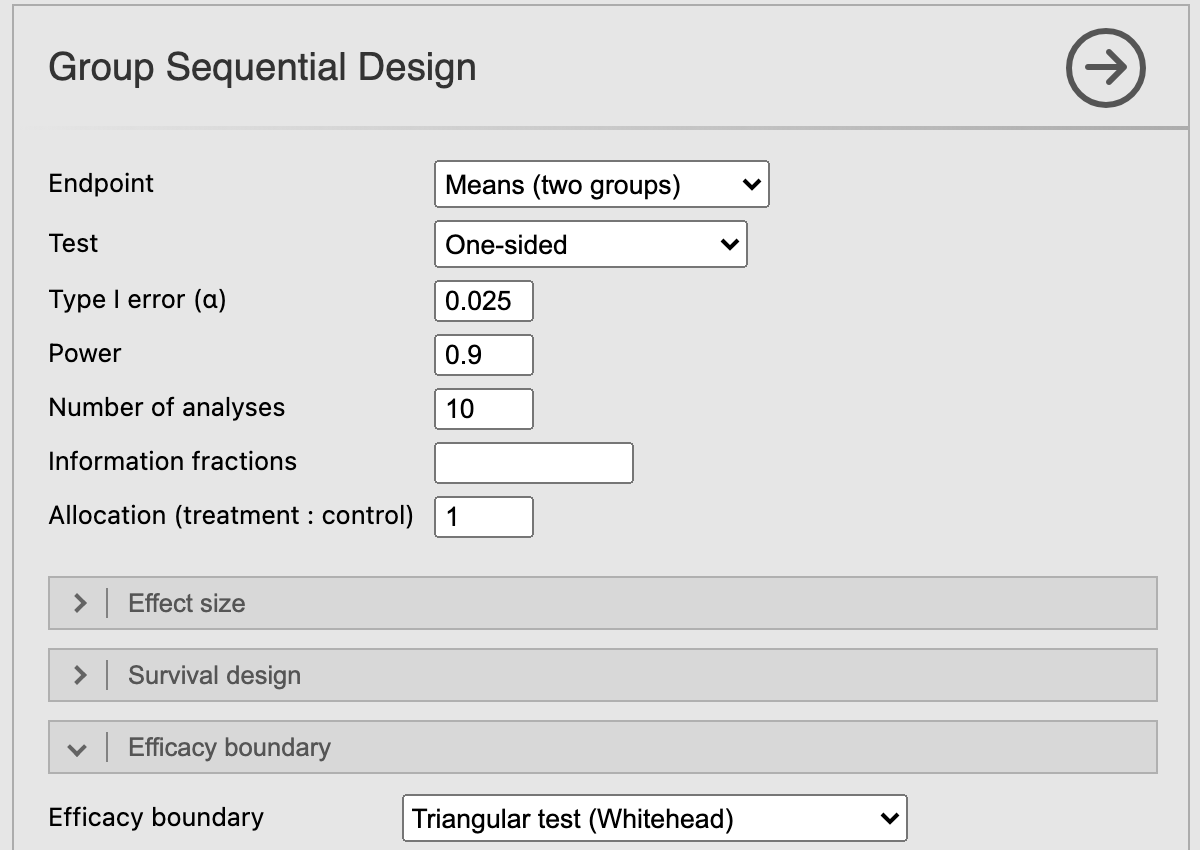
Sequential → Group Sequential Design (from version 0.1.0). Under Efficacy boundary choose Triangular test (Whitehead); two-sided designs give the double triangular test. The results show the exact attained \(\alpha\) and power next to the nominal values. To see the triangle in the boundary plot, set Boundary scale to B-value (Z·√t) and Horizontal axis to Information fraction: the B-value is Whitehead’s score up to a constant, so the boundaries are straight lines. For continuous (observation by observation) triangular monitoring, choose Triangular test (Whitehead, continuous) in the SPRT analysis (from version 0.3.0).
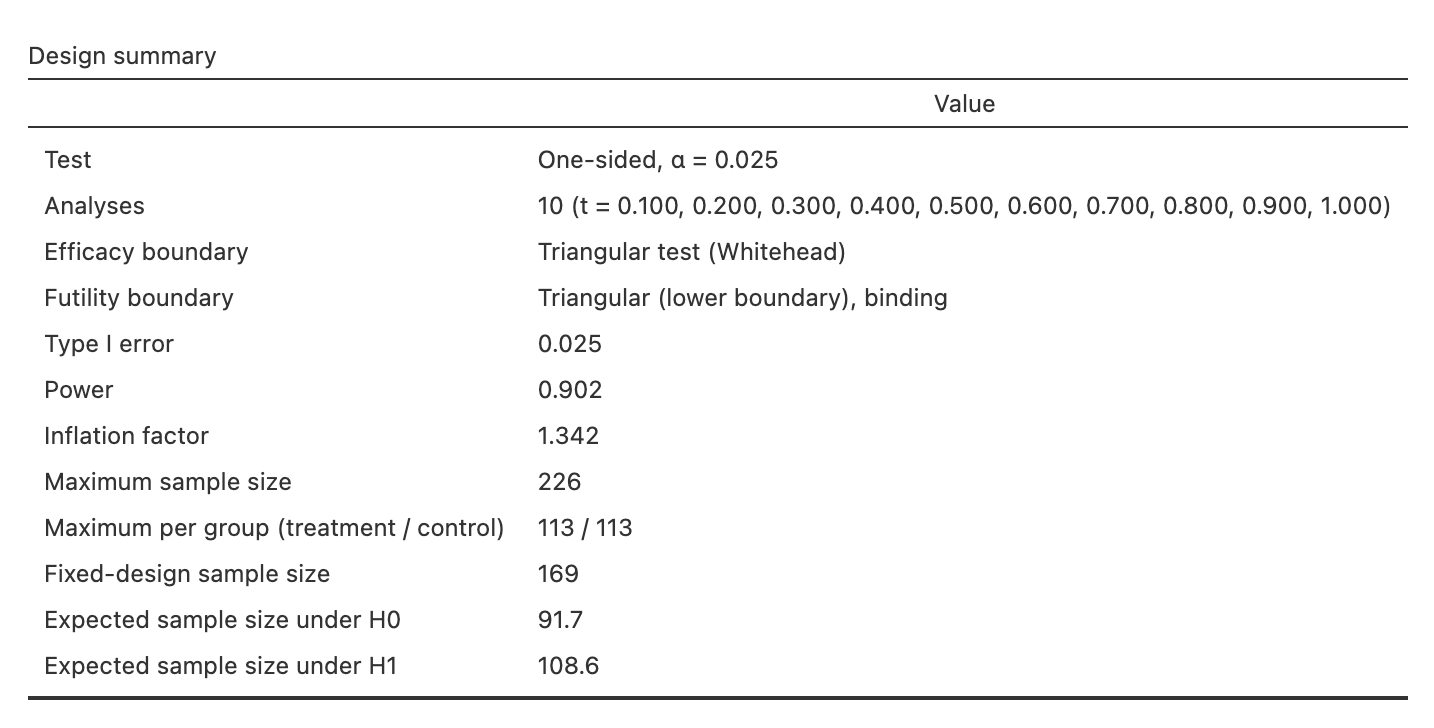
The design summary gives the ten-look row of Table 1 for the default endpoint (a difference in means of 0.5, SD 1): attained α 0.025 and power 0.902, at most 226 patients (inflation factor 1.342) against 169 for a fixed design, and 91.7 and 108.6 patients expected under H0 and H1.