jamovi syntax
all <- prognosis::km(data = lung, elapsed = time, event = event, eventLevel = "dead",
timeUnit = "months", survTimes = "6, 12, 24", ci = TRUE)Question. In advanced lung cancer, how long do patients survive, and does survival depend on performance status (ECOG) at enrolment?
Open lung.omv in jamovi. The Variables tab lists the variables, with an icon for each measure type (Figure 1): time and age must be Continuous (ruler), event and sex Nominal (circles), and ecog Ordinal (bars). Double-click a variable to see its setup; the levels of ecog must be in the order ECOG 0, ECOG 1, ECOG 2.
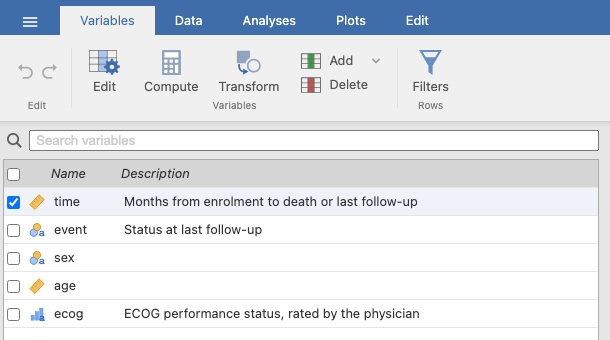
The module needs the event as a nominal (or ordinal) variable and asks which of its levels is the event. A column coded 0/1 works once you set its measure type to Nominal. Until you pick the level, the analysis shows nothing, on purpose: guessing which code means “event” is a classic source of errors (in the original lung data, 1 means censored and 2 means dead).
Open Analyses → Prognosis → Kaplan-Meier and set:
| Panel | Setting |
|---|---|
| Time | time |
| Event | event; Event level dead |
| Tables → Survival at times | 6, 12, 24 |
| Tables → Time unit | months |
| Show on plots | Confidence bands |
all <- prognosis::km(data = lung, elapsed = time, event = event, eventLevel = "dead",
timeUnit = "months", survTimes = "6, 12, 24", ci = TRUE)Survival summary
| 95% CI | |||||
|---|---|---|---|---|---|
| N | Events | Censored | Median | Lower | Upper |
| 226 | 163 | 63 | 10.2 | 9.36 | 11.9 |
Survival at given times
| 95% CI | |||||
|---|---|---|---|---|---|
| Time | At risk | Events | Survival | Lower | Upper |
| 6.00 | 156 | 64 | 71.4 % | 65.8 % | 77.6 % |
| 12.00 | 65 | 119 | 41.3 % | 34.8 % | 49.0 % |
| 24.00 | 13 | 157 | 11.7 % | 7.2 % | 18.8 % |
Median survival was 10.18 months (95% CI 9.36–11.93). Survival was 41% at one year and 12% at two years; only 13 patients were still under observation at 24 months, which is why that CI is wide relative to the estimate.
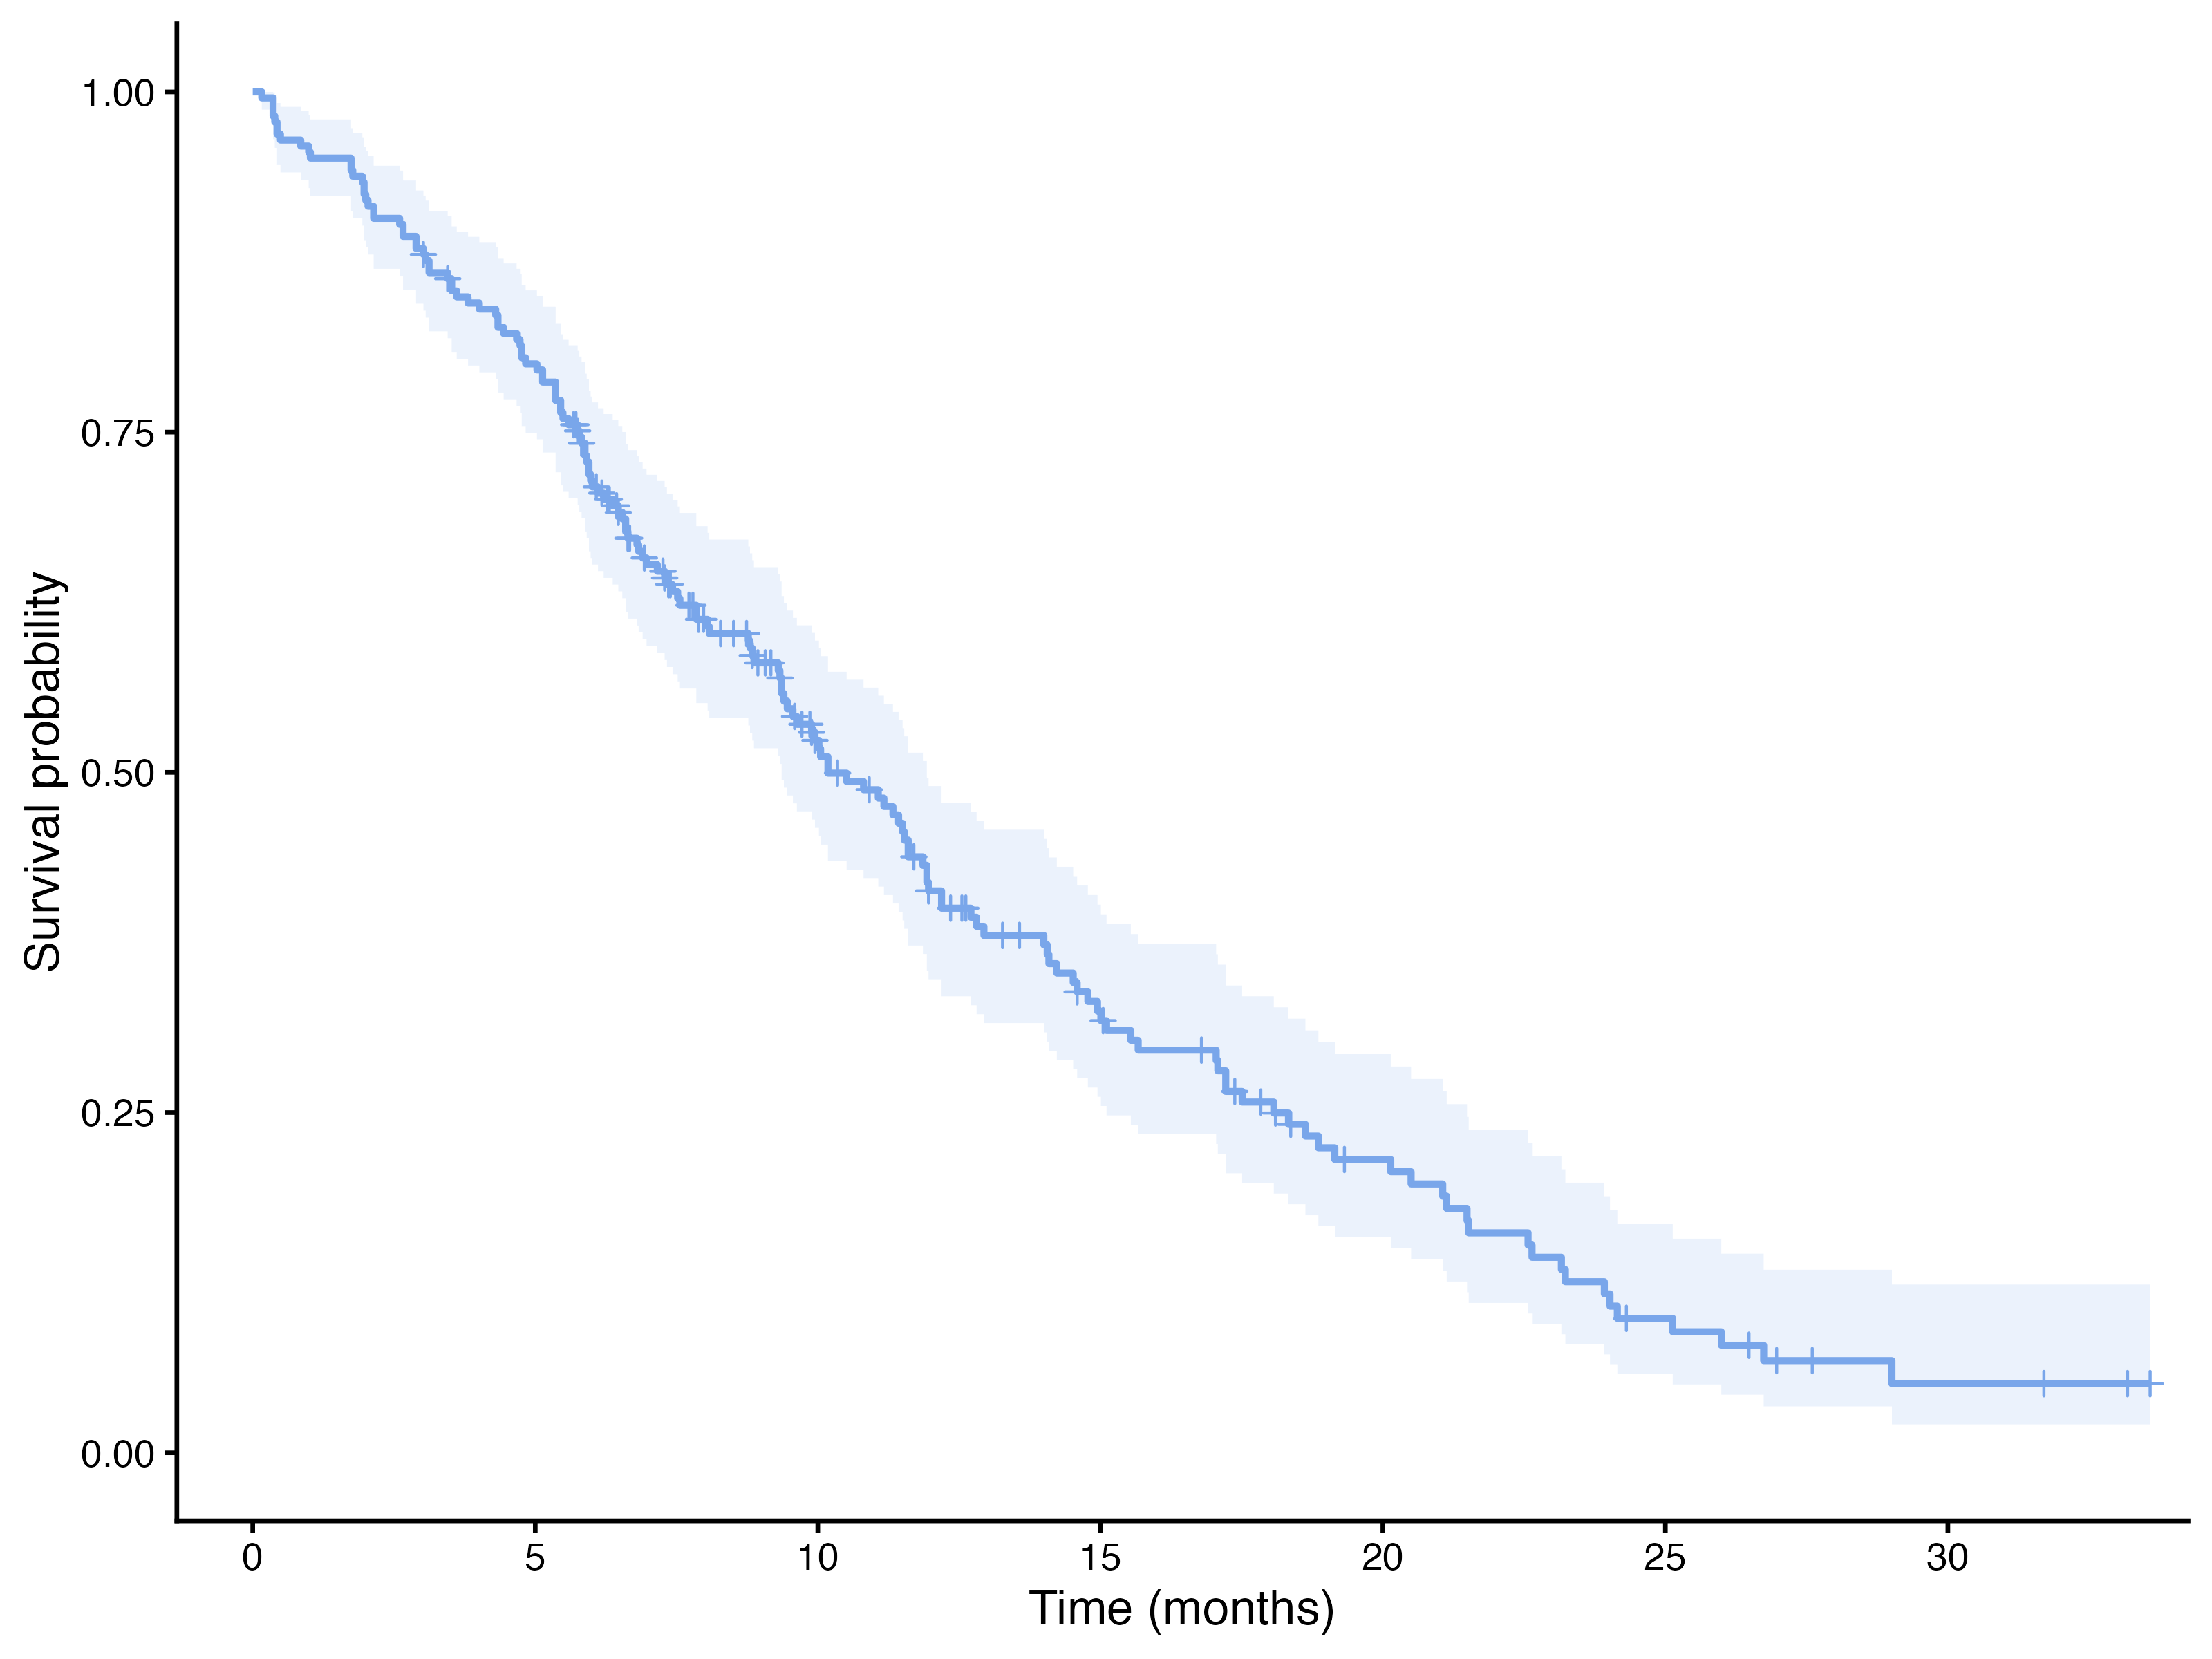
A paper should say how long patients were followed. The median of the observed times (8.62 months) underestimates follow-up, because patients who died stop contributing time early. The usual method is the reverse Kaplan-Meier: swap the roles of event and censoring, so that “being censored” is the event. In the module, simply choose alive as the event level:
revkm <- prognosis::km(data = lung, elapsed = time, event = event, eventLevel = "alive",
                     kmPlot = FALSE)
Survival summary
| 95% CI | |||||
|---|---|---|---|---|---|
| N | Events | Censored | Median | Lower | Upper |
| 226 | 63 | 163 | 19.3 | 16.8 | 33.2 |
The median follow-up was 19.32 months (95% CI 16.79–33.18). Change the event level back to dead before going on.
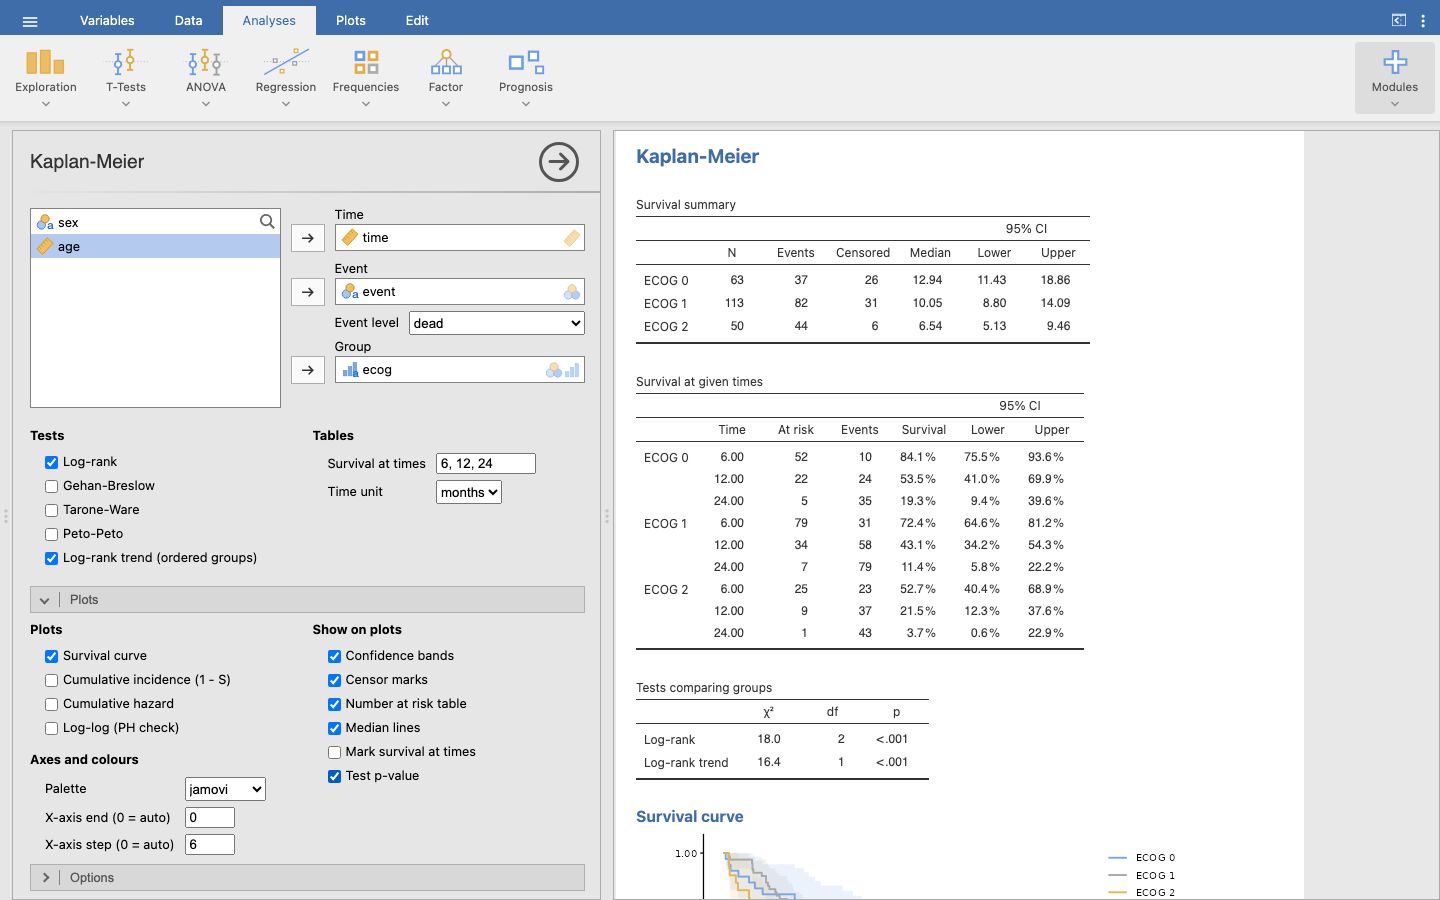
Add ecog to Group, and set:
| Panel | Setting |
|---|---|
| Tests | Log-rank; Log-rank trend (ordered groups) |
| Show on plots | Confidence bands, Number at risk table, Median lines, Test p-value |
| Axes and colours | X-axis step 6 |
| Options | Show explanations |
Figure 3 shows the analysis in jamovi with these settings: the options panel on the left, the results on the right.
r <- prognosis::km(data = lung, elapsed = time, event = event, eventLevel = "dead",
                   group = ecog, timeUnit = "months", survTimes = "6, 12, 24",
                   tests = c("logrank", "trend"), ci = TRUE, riskTable = TRUE,
                   medianLine = TRUE, pvalPlot = TRUE, xby = 6, showExplanations = TRUE)
Survival summary
| 95% CI | ||||||
|---|---|---|---|---|---|---|
| N | Events | Censored | Median | Lower | Upper | |
| ECOG 0 | 63 | 37 | 26 | 12.94 | 11.43 | 18.86 |
| ECOG 1 | 113 | 82 | 31 | 10.05 | 8.80 | 14.09 |
| ECOG 2 | 50 | 44 | 6 | 6.54 | 5.13 | 9.46 |
| Note. Median: time at which the Kaplan-Meier survival falls to 50%; empty if not reached. | ||||||
Median survival fell from 12.94 months with ECOG 0 to 10.05 with ECOG 1 and 6.54 with ECOG 2. The notes under each table are the explanations; switch them off when you know the tables.
Survival at given times
| 95% CI | ||||||
|---|---|---|---|---|---|---|
| Time | At risk | Events | Survival | Lower | Upper | |
| ECOG 0 | 6.00 | 52 | 10 | 84.1 % | 75.5 % | 93.6 % |
| 12.00 | 22 | 24 | 53.5 % | 41.0 % | 69.9 % | |
| 24.00 | 5 | 35 | 19.3 % | 9.4 % | 39.6 % | |
| ECOG 1 | 6.00 | 79 | 31 | 72.4 % | 64.6 % | 81.2 % |
| 12.00 | 34 | 58 | 43.1 % | 34.2 % | 54.3 % | |
| 24.00 | 7 | 79 | 11.4 % | 5.8 % | 22.2 % | |
| ECOG 2 | 6.00 | 25 | 23 | 52.7 % | 40.4 % | 68.9 % |
| 12.00 | 9 | 37 | 21.5 % | 12.3 % | 37.6 % | |
| 24.00 | 1 | 43 | 3.7 % | 0.6 % | 22.9 % | |
| Note. Survival: Kaplan-Meier probability of being event-free at that time. Events: cumulative events up to that time. | ||||||
Survival at one year was 54% for ECOG 0, 43% for ECOG 1 and 21% for ECOG 2. The Events column is cumulative: by 12 months 37 of the 50 ECOG 2 patients had died. At 24 months only 1 ECOG 2 patient was still at risk: the estimate exists, but its CI shows it carries little information.
Tests comparing groups
| χ² | df | p | |
|---|---|---|---|
| Log-rank | 18.0 | 2 | < .001 |
| Log-rank trend | 16.4 | 1 | < .001 |
| Note. H0: the survival curves are identical. Log-rank weights all event times equally; Gehan-Breslow and Tarone-Ware give more weight to early times, Peto-Peto weights by overall survival. The trend test (1 df) uses the group order as scores. | |||
The log-rank test compares the three curves: χ² = 18.01 on 2 df, p < 0.001. Because ECOG is ordered, the trend test asks the more specific question of a steady decline in survival from ECOG 0 to 2: χ² = 16.45 on 1 df, p < 0.001. Most of the difference between the groups is this trend.
The module reports the test; the observed and expected deaths behind it (see the log-rank page) are:
| Group | Observed | Expected | O − E |
|---|---|---|---|
| ECOG 0 | 37 | 53.9 | -16.9 |
| ECOG 1 | 82 | 83.1 | -1.1 |
| ECOG 2 | 44 | 26.0 | 18.0 |
ECOG 0 patients had fewer deaths than expected if all groups shared one curve, ECOG 2 patients many more, and ECOG 1 almost exactly the expected number.
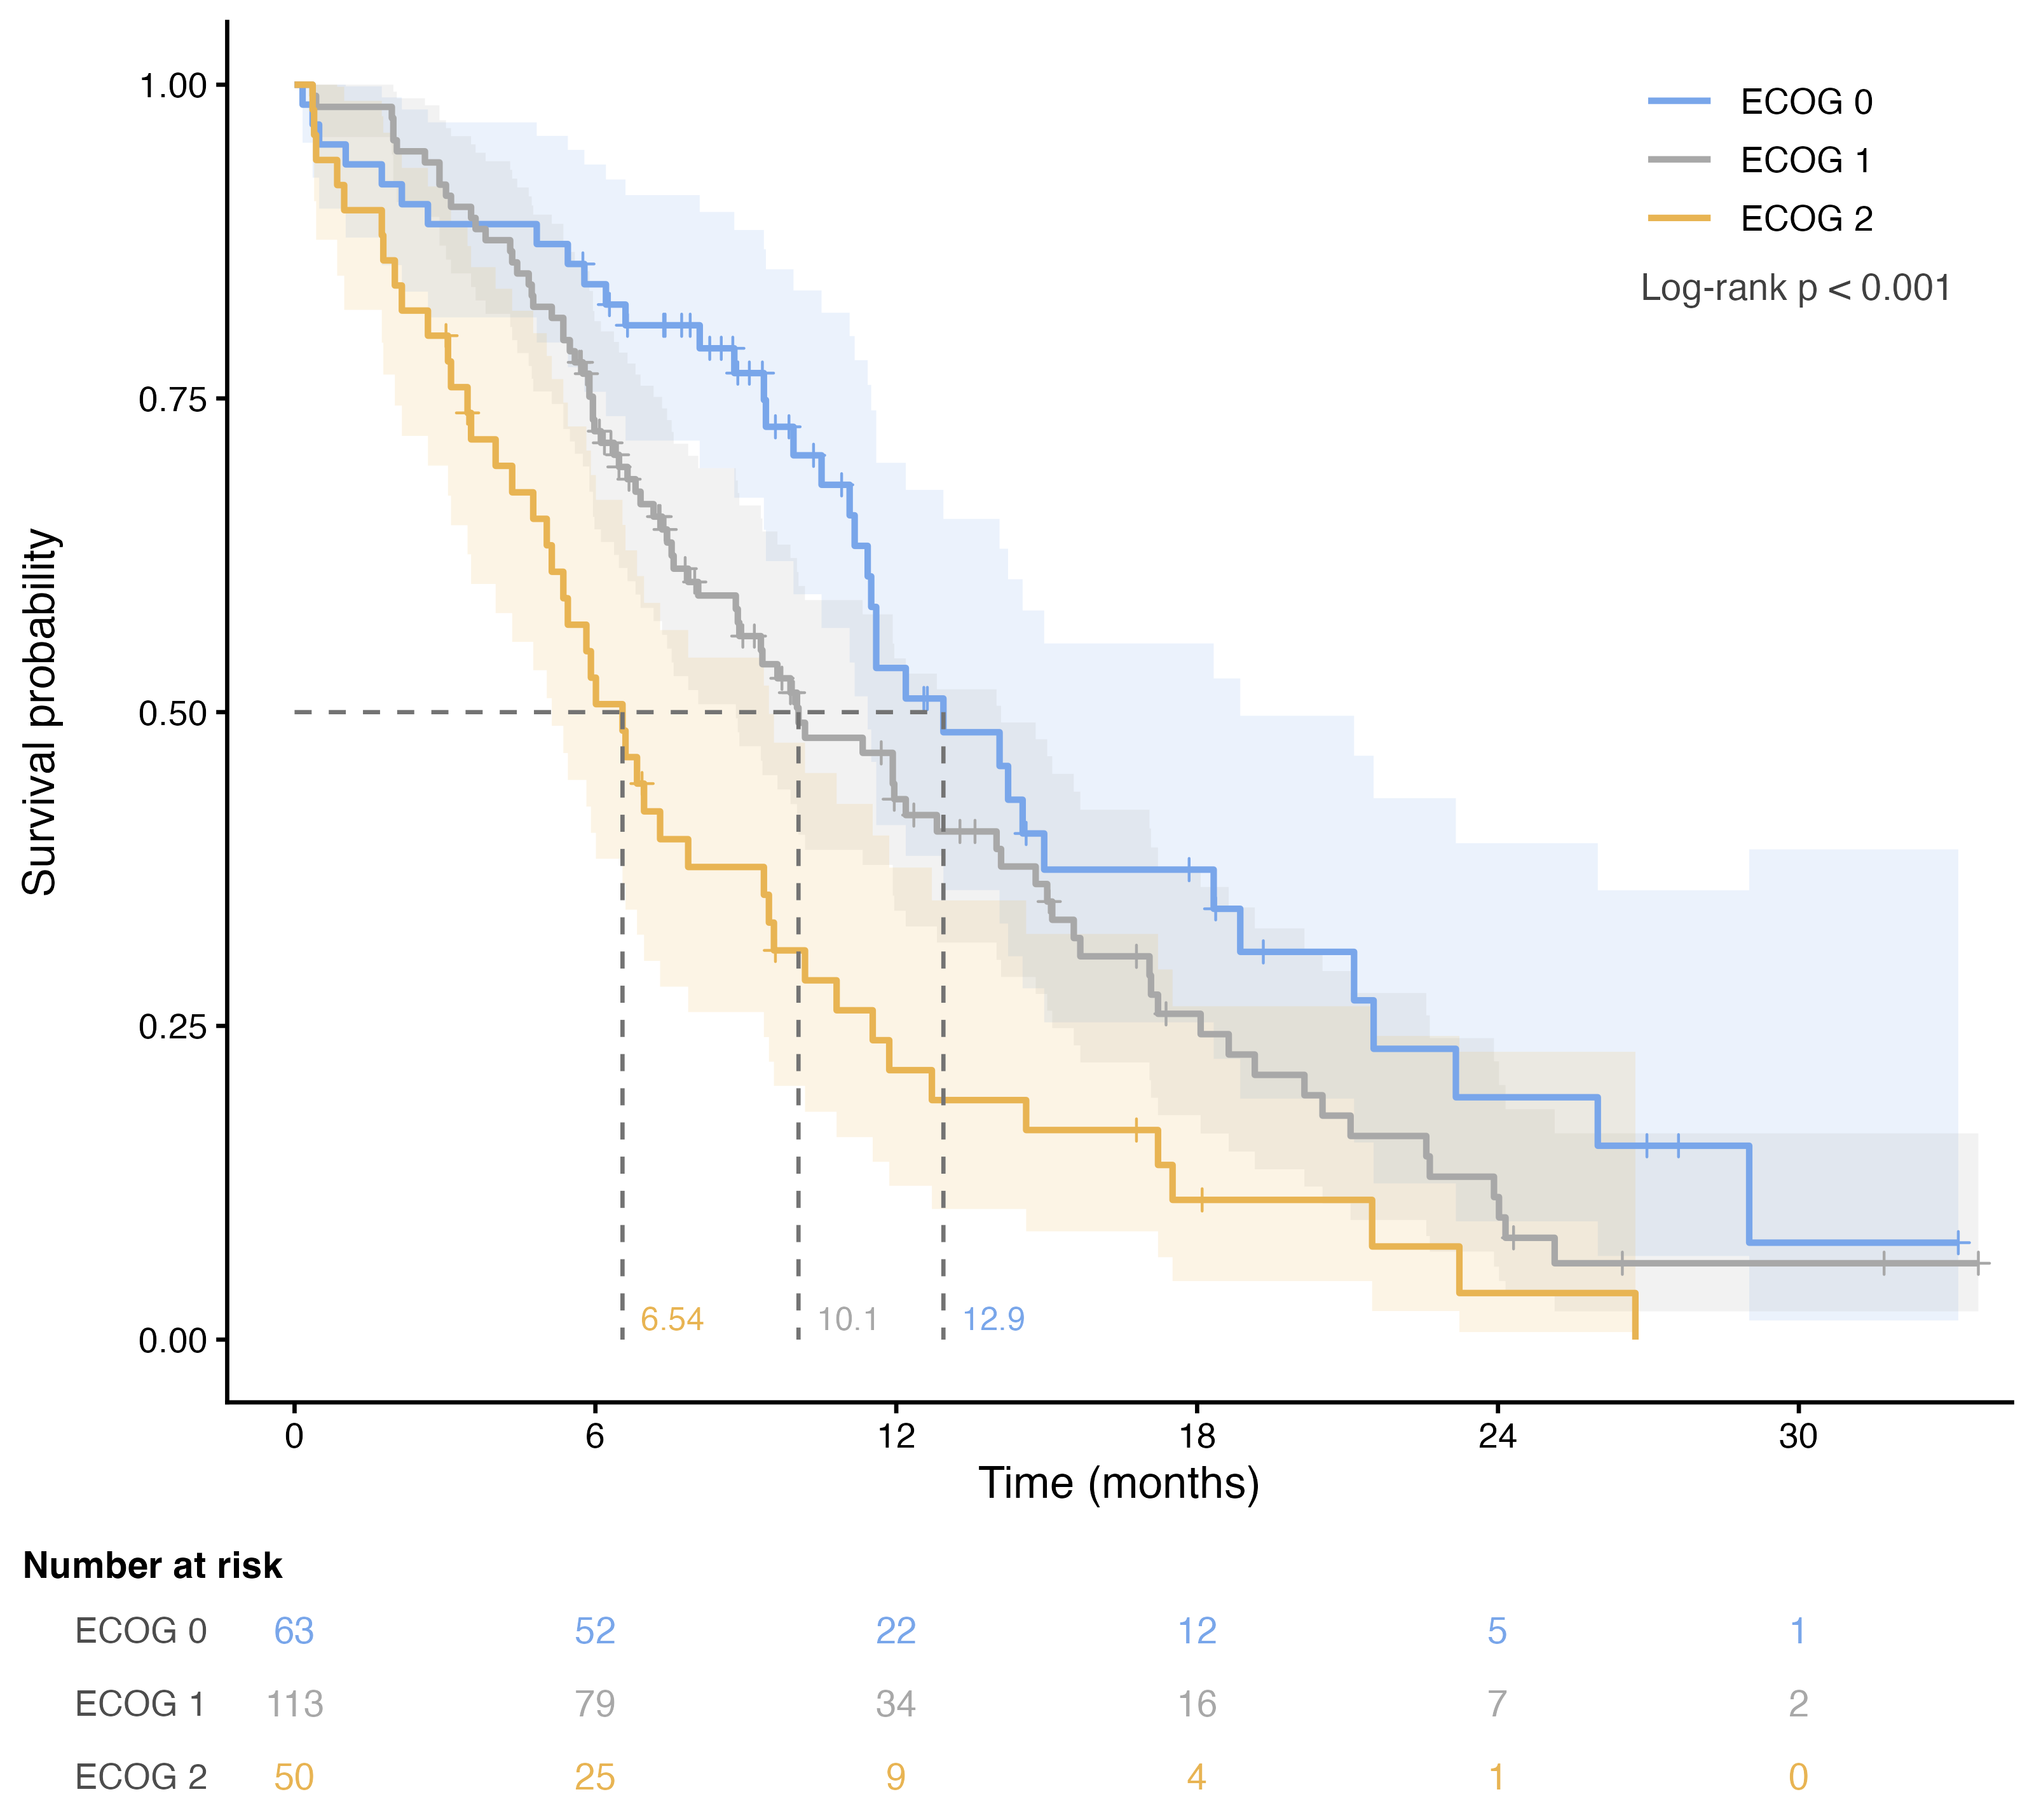
Read the plot as a sceptical reader would: the curves start at 1 and separate early; the median lines agree with the table; the bands widen to the right as the numbers at risk fall; and after about 24 months the curves rest on a handful of patients.
Tick Cumulative incidence (1 − S), Cumulative hazard and Log-log (PH check) under Plots. They use the same data and the same options.
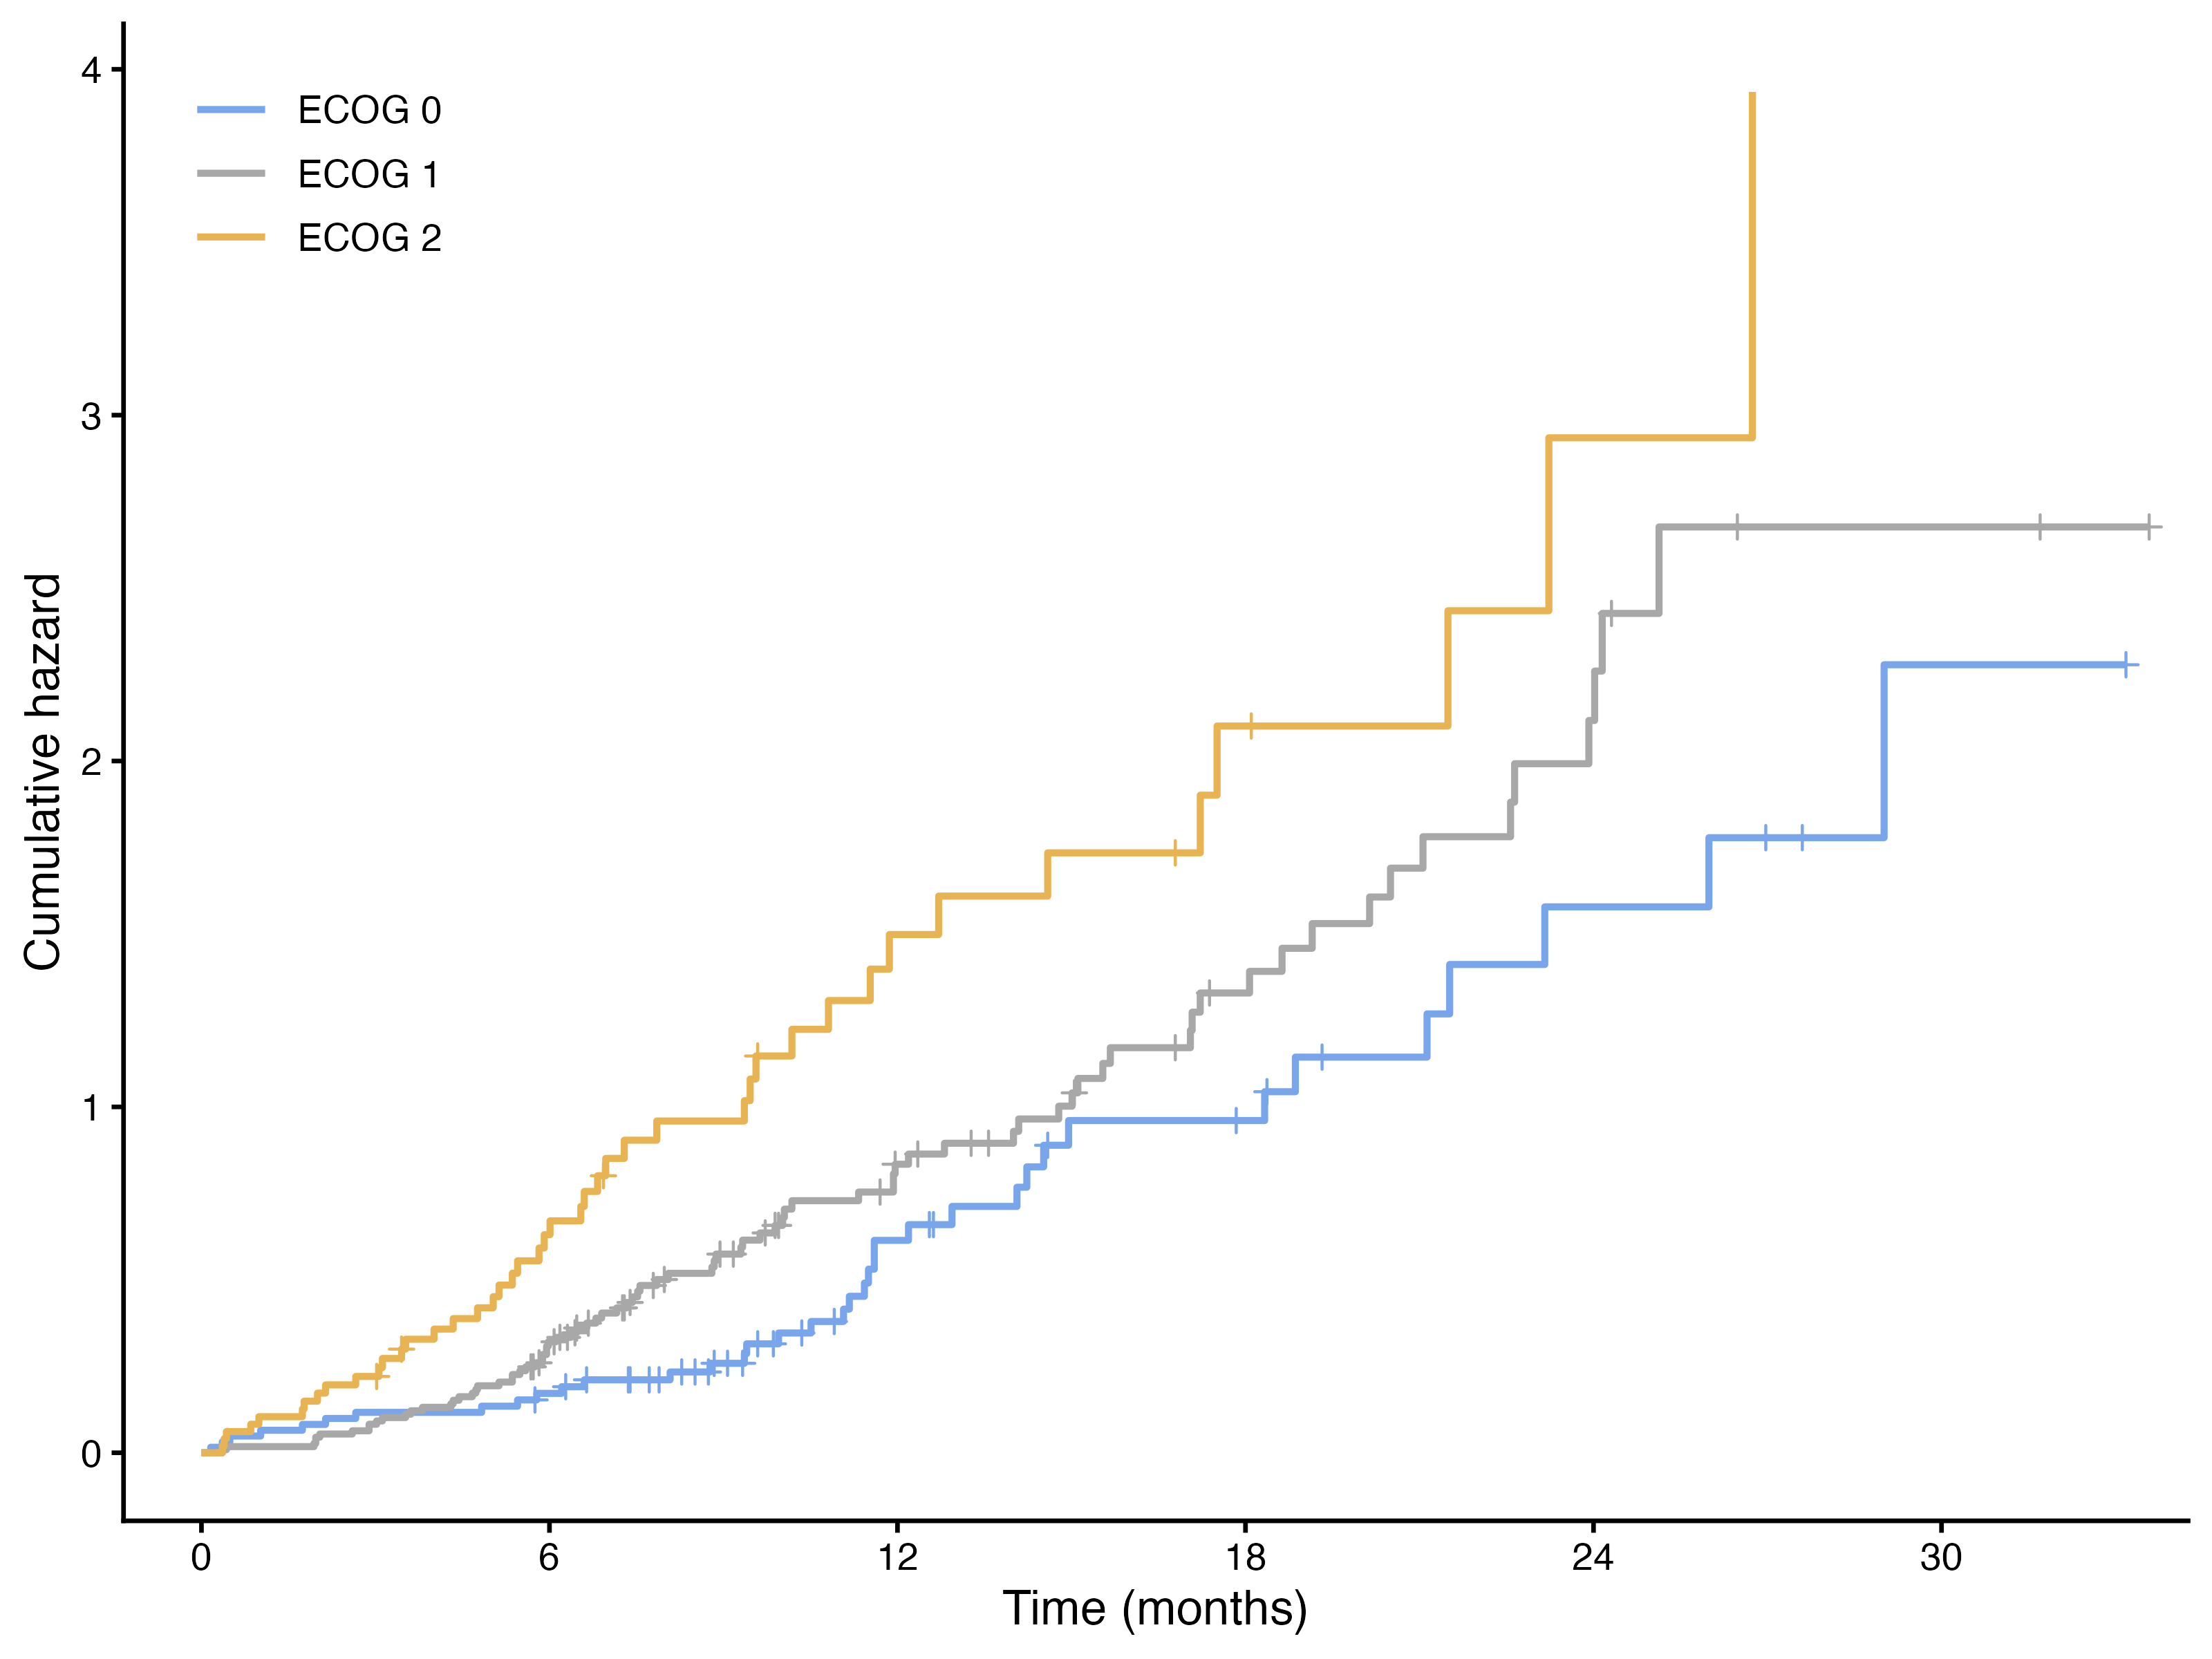
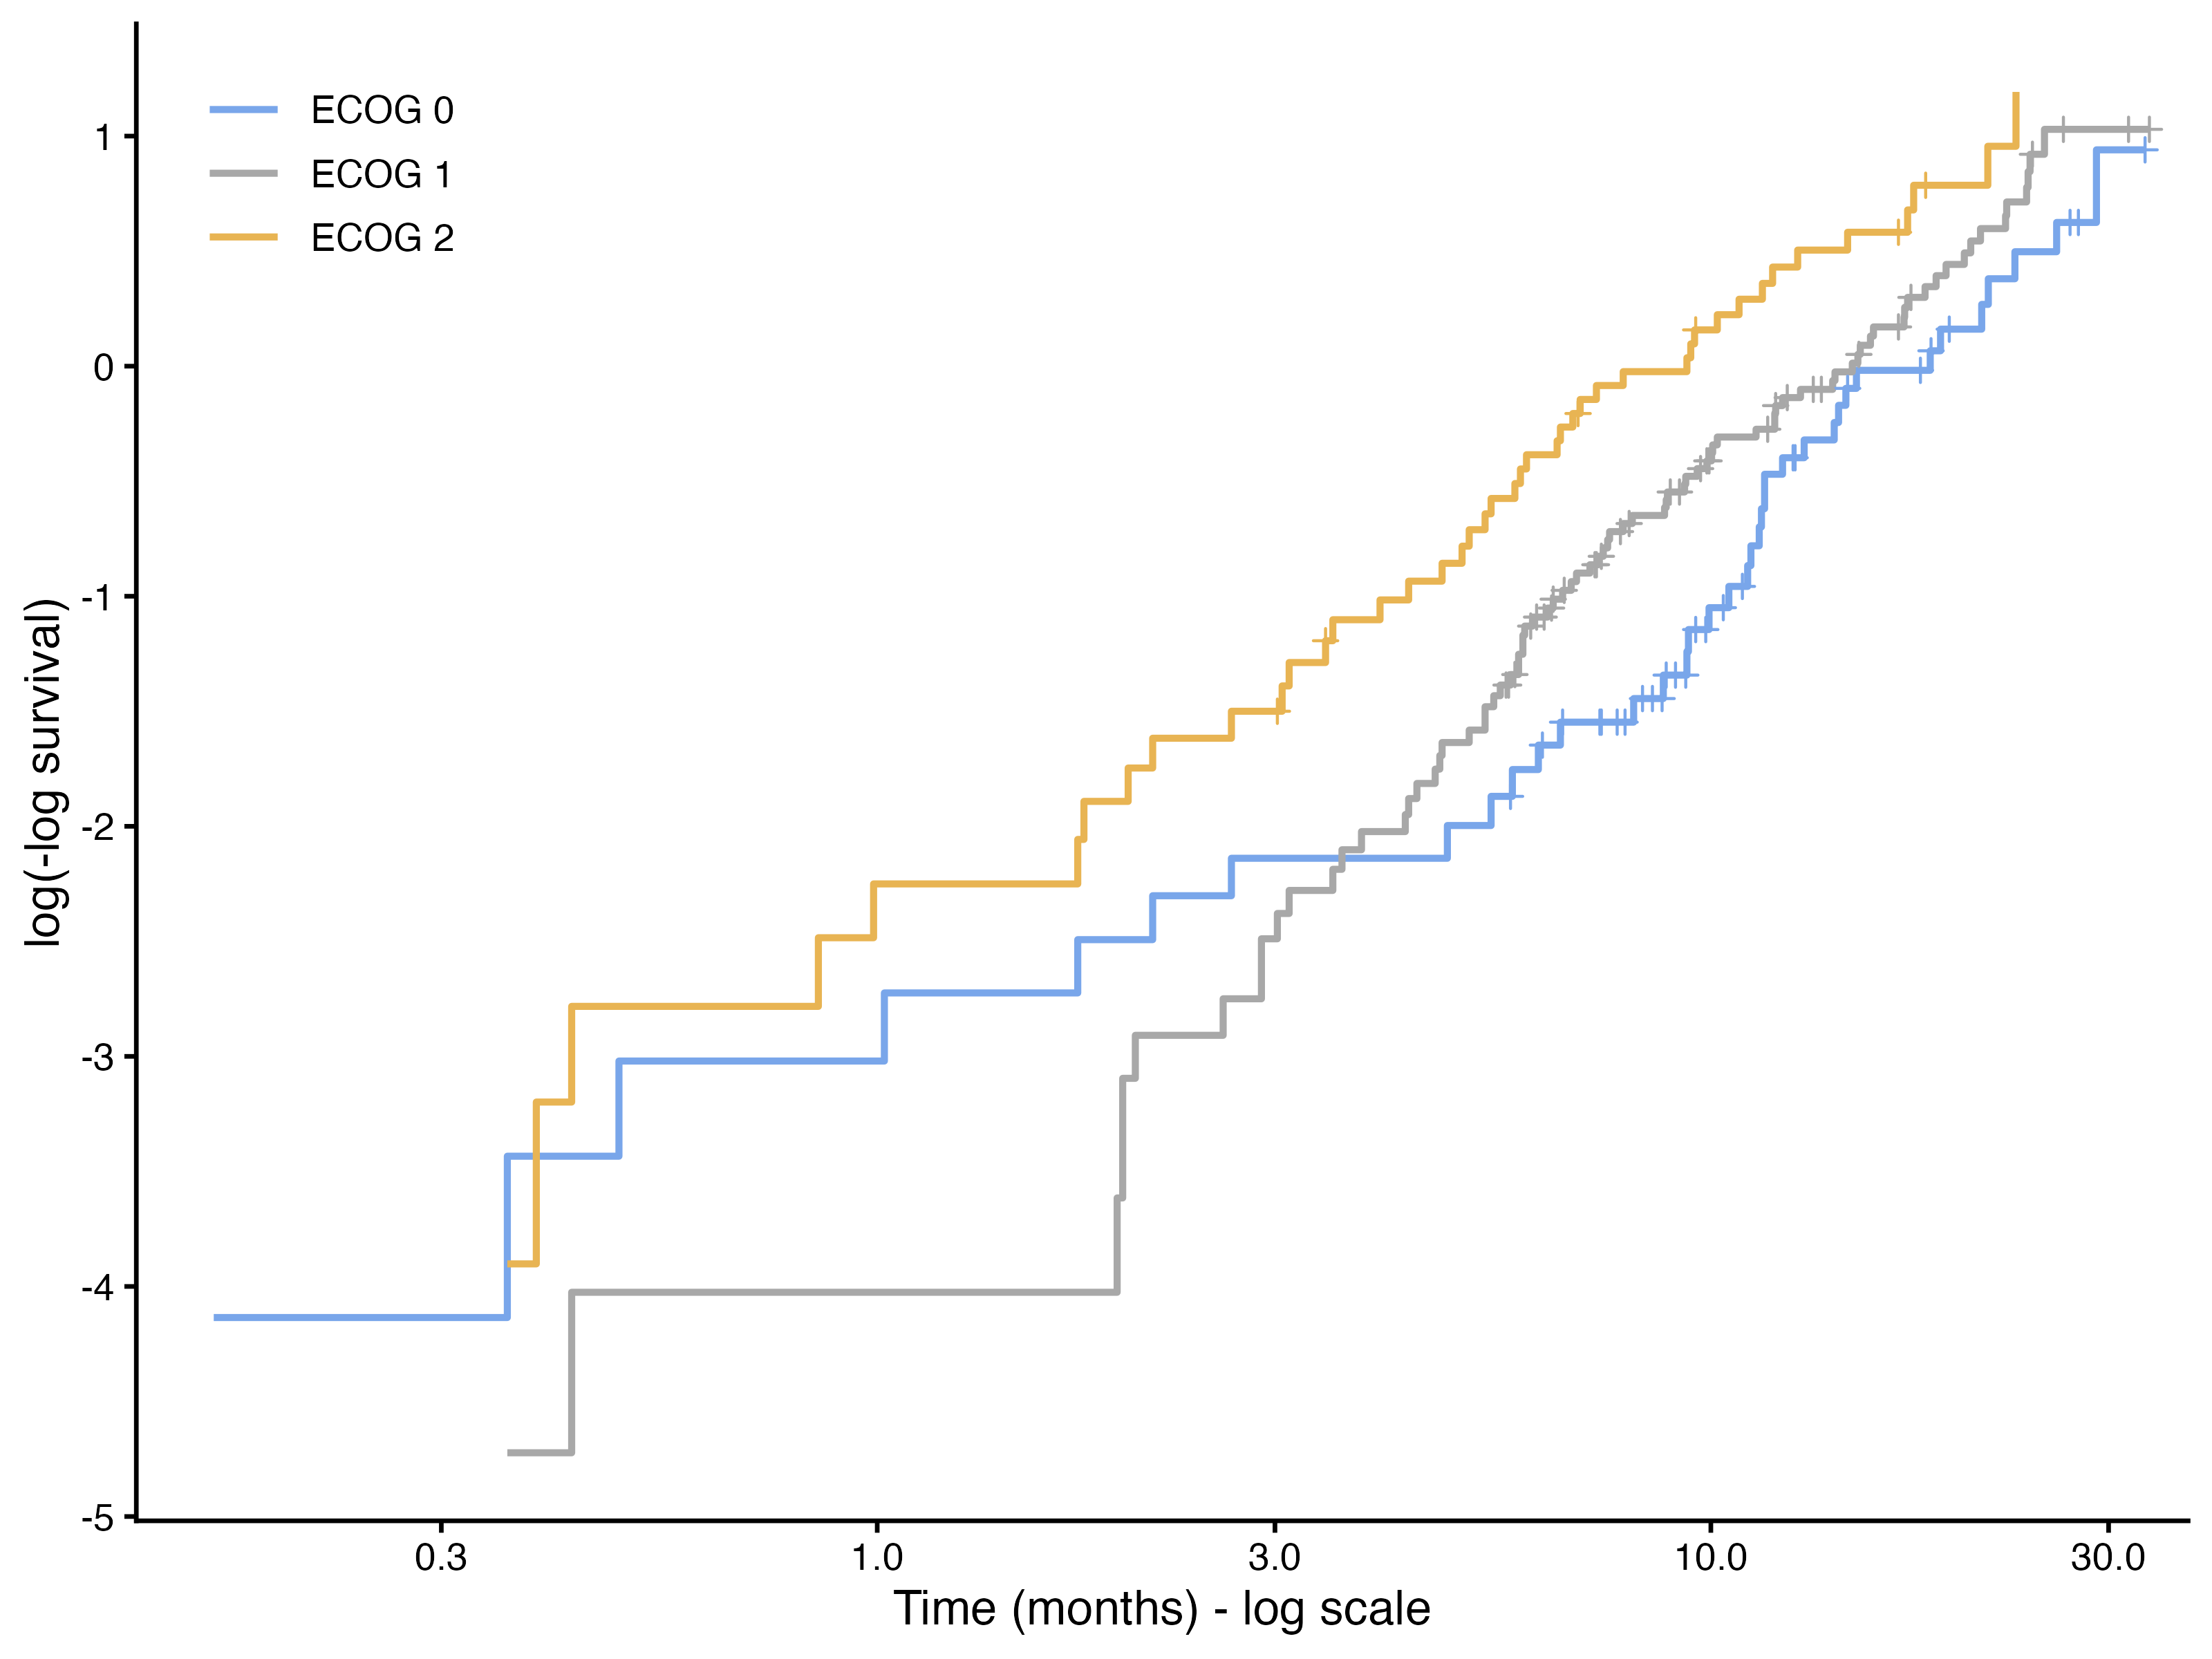
ECOG 2 stays above the other two and roughly parallel to them. ECOG 0 and ECOG 1 cross in the first four months, but each step there is a single death, and they come closer again after about a year: a hint, no more, that the difference between ECOG 0 and 1 is not constant over time. The assumptions page checks this formally.
Of 226 patients with advanced non-small-cell lung cancer, 163 died during a median follow-up of 19.3 months (reverse Kaplan-Meier). Median survival was 10.2 months (95% CI 9.4–11.9) and 1-year survival 41% (95% CI 35%–49%). Survival decreased with worse performance status: median 12.9, 10.1 and 6.5 months, and 1-year survival 54%, 43% and 21%, for ECOG 0, 1 and 2 (log-rank χ² = 18.0, 2 df, p < 0.001; test for trend p < 0.001).
What this does not say is whether ECOG predicts survival independently of age and sex. That needs Cox regression.