jamovi syntax
r <- prognosis::cox(data = lung, elapsed = time, event = event, eventLevel = "dead",
                    factors = vars(sex, ecog), covs = age, adjCurves = TRUE,
timeUnit = "months")Question. The Kaplan-Meier curves by ECOG compare groups that also differ in age and in the proportion of women. What would the curves look like if the three ECOG groups had the same age and sex distribution?
Hazard ratios answer this on the hazard scale; adjusted survival curves answer it on the scale of survival probabilities, which is easier to communicate.
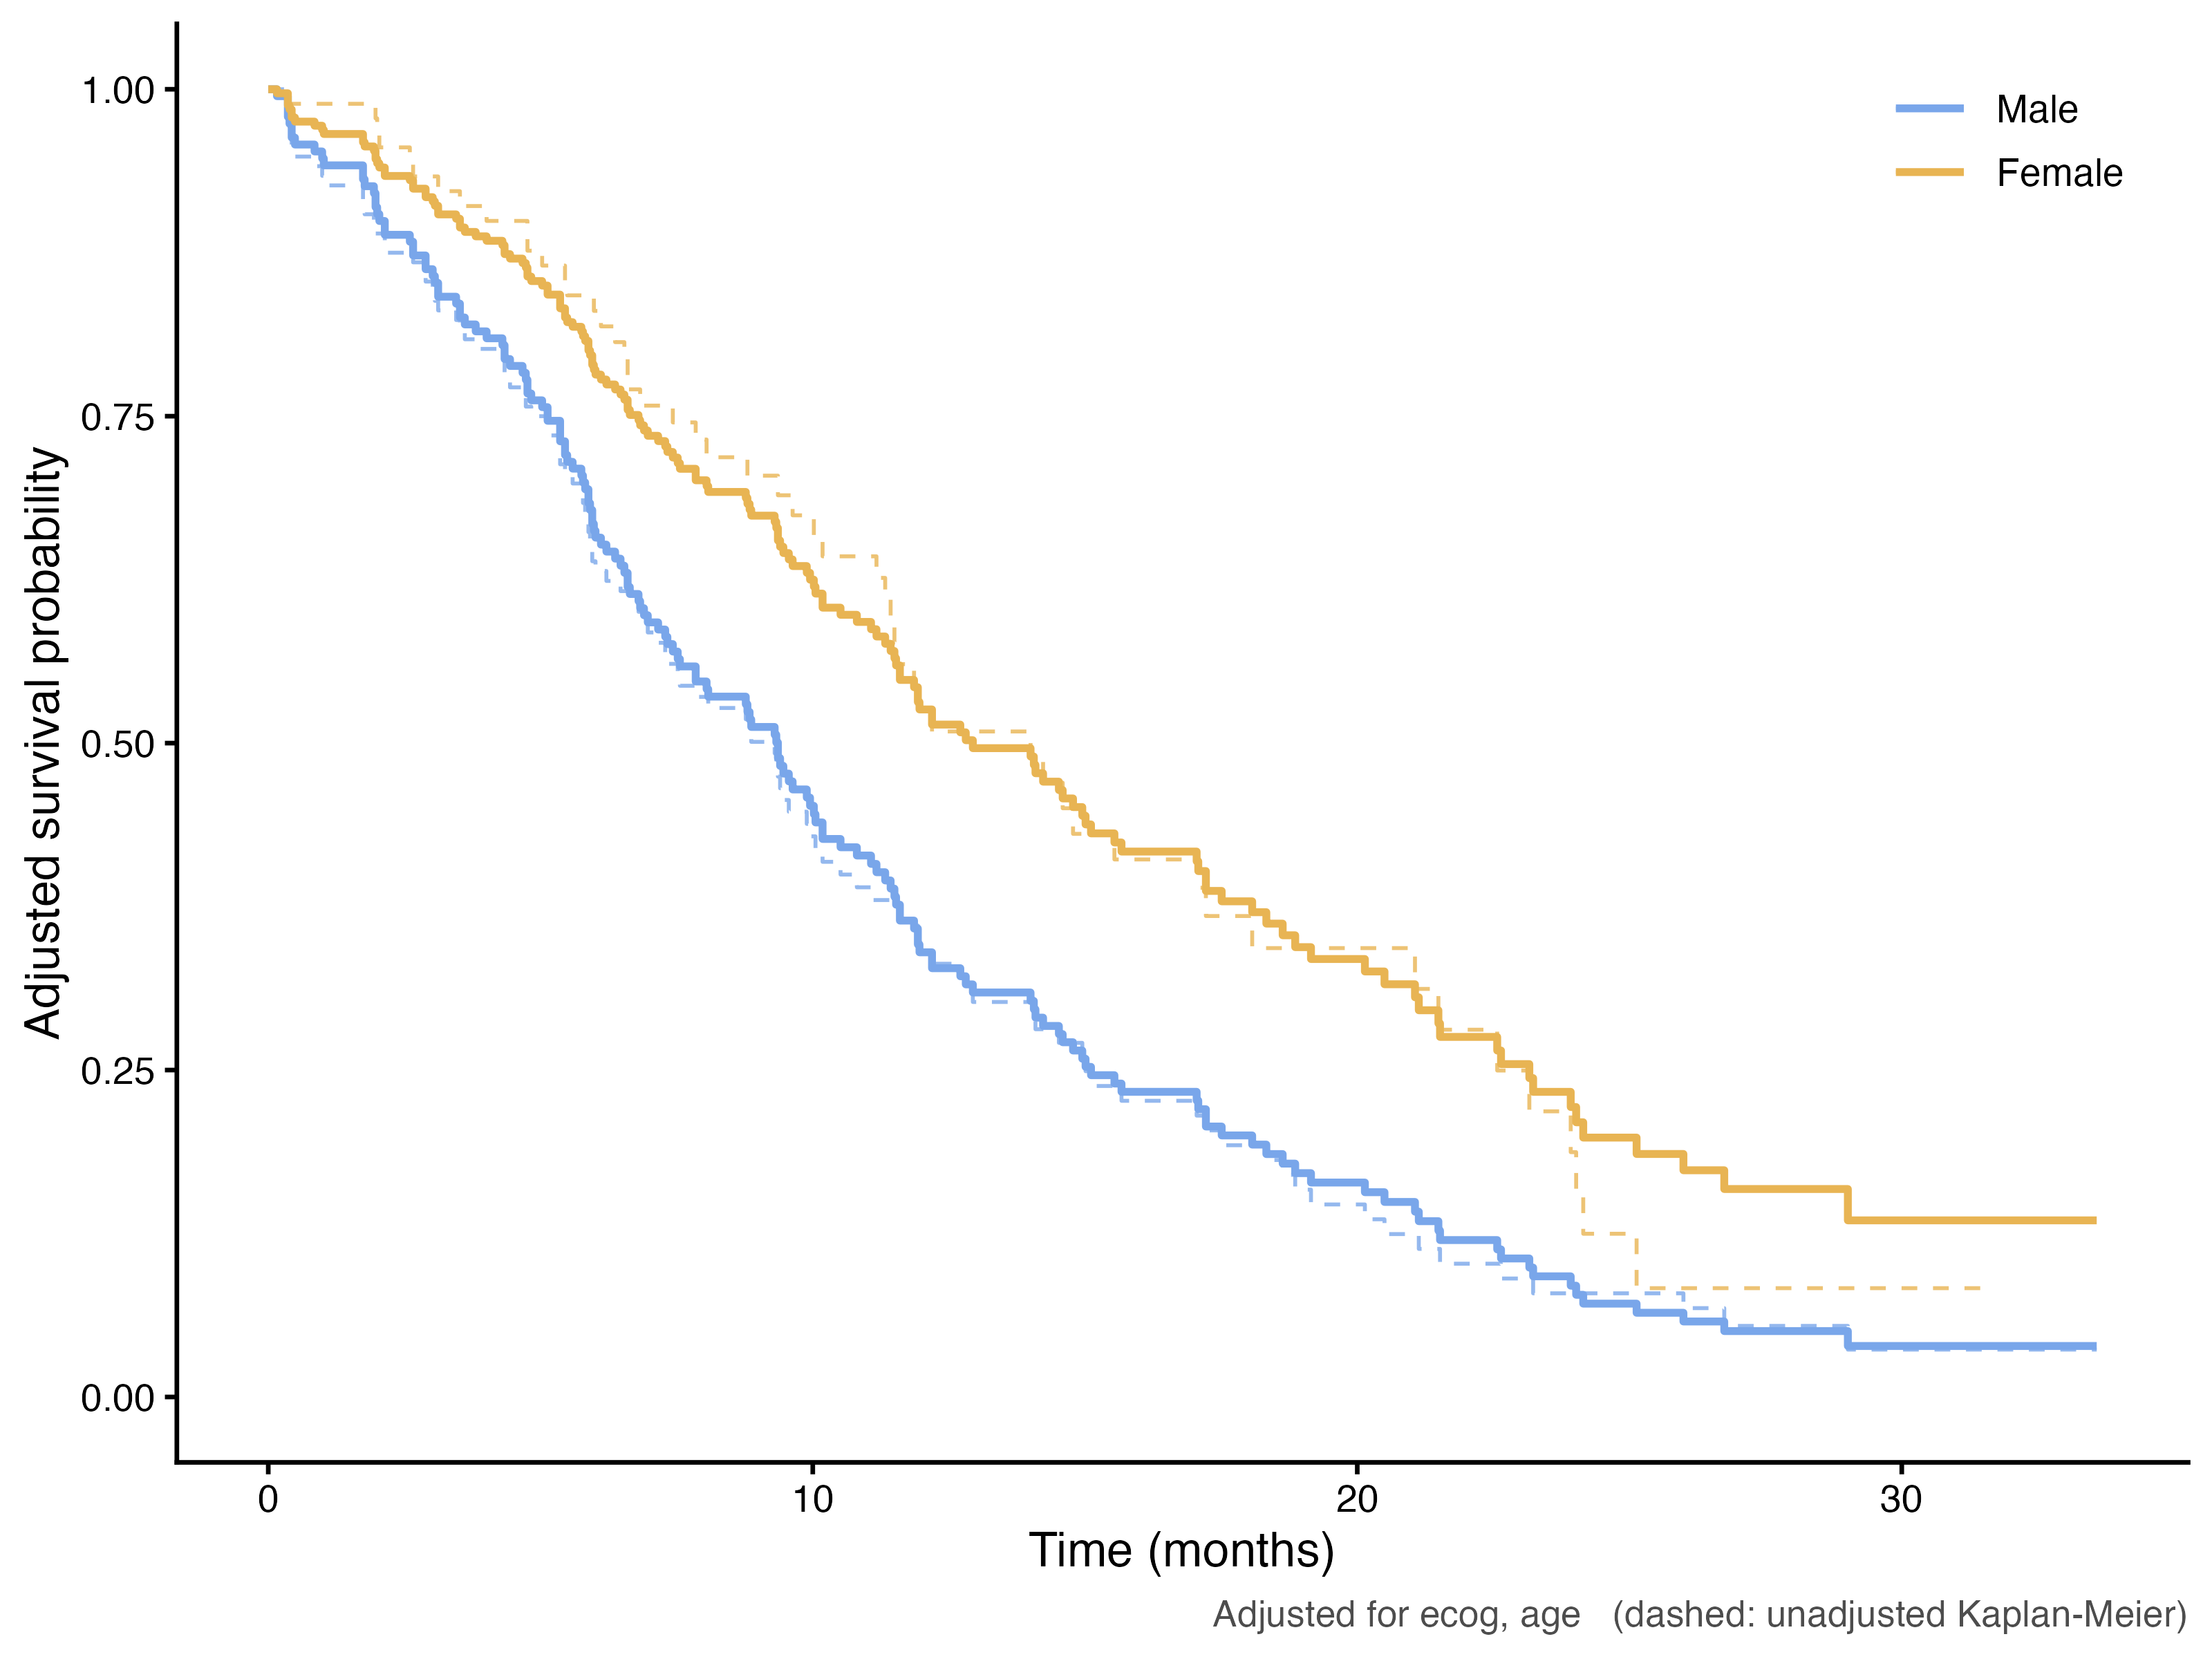
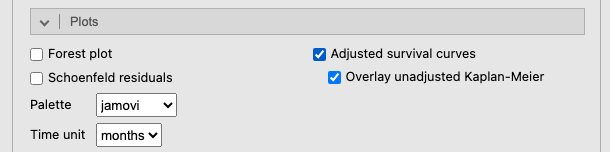
In the Cox model of the Cox example (Factors sex, ecog; Covariate age), tick Adjusted survival curves under Plots (Figure 1). Overlay unadjusted Kaplan-Meier is on by default; Time unit labels the time axis.
r <- prognosis::cox(data = lung, elapsed = time, event = event, eventLevel = "dead",
factors = vars(sex, ecog), covs = age, adjCurves = TRUE,
timeUnit = "months")The module draws one plot for each factor of the model; covariates such as age get no plot.
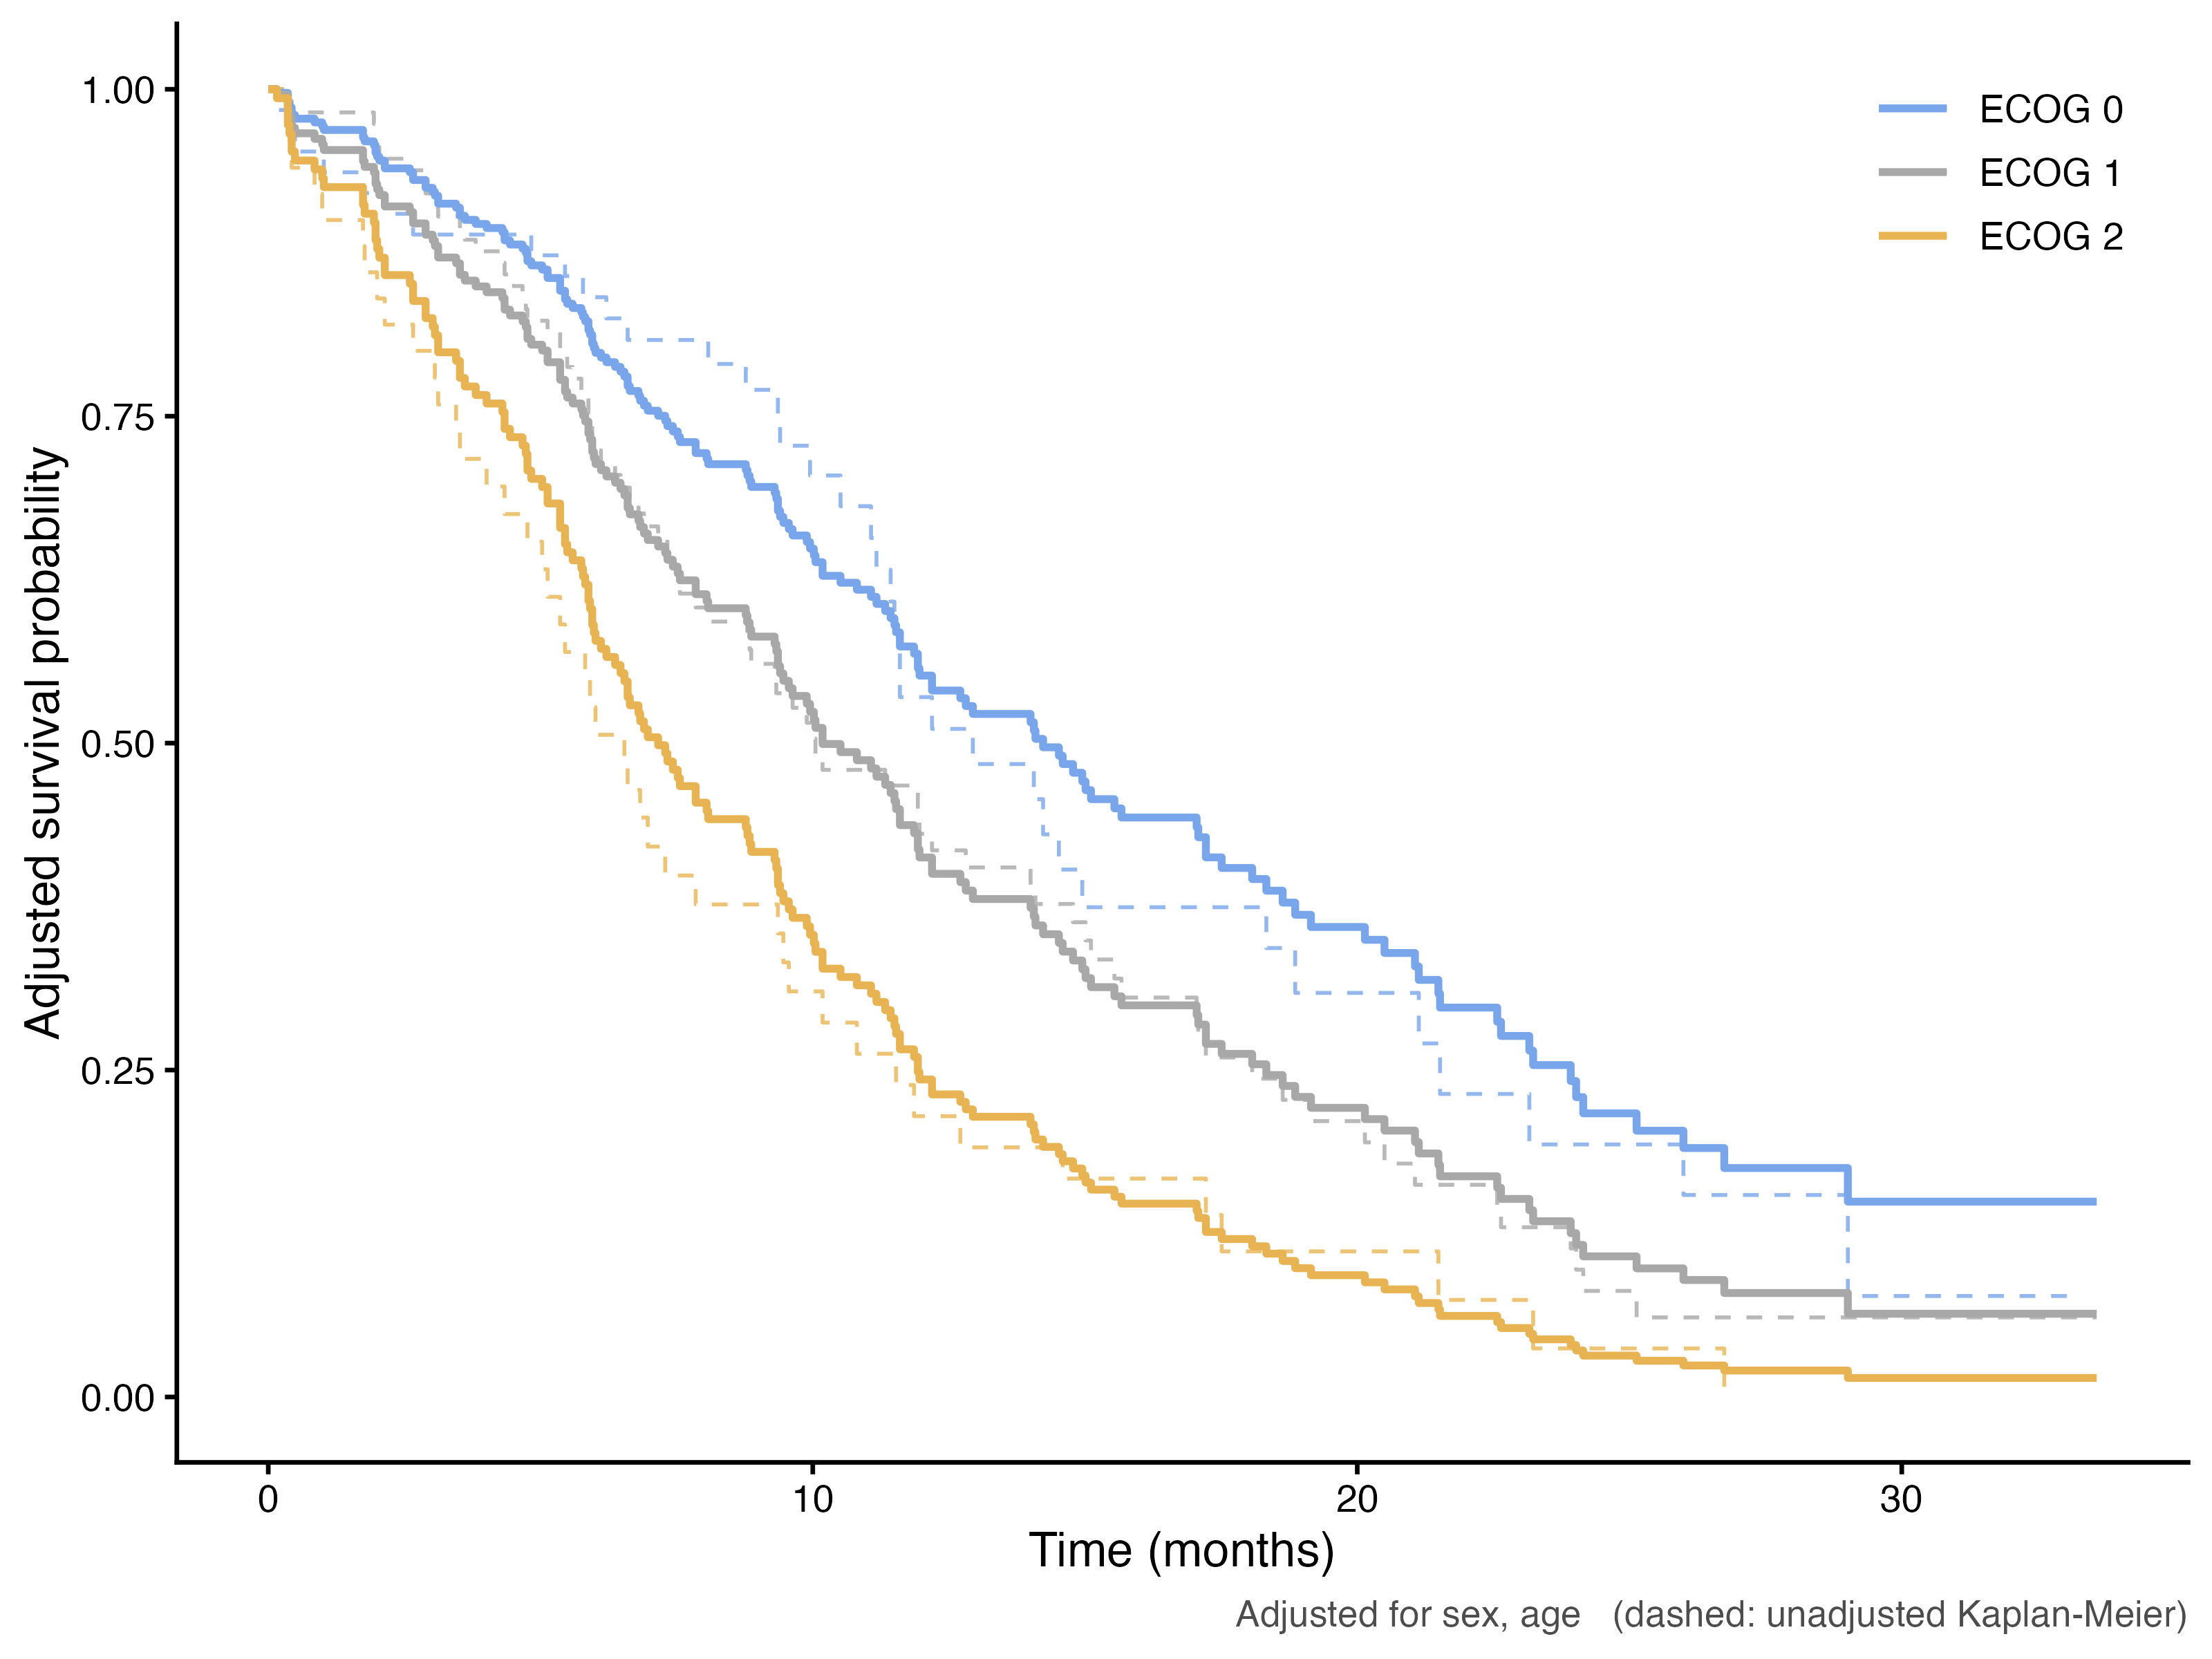
The module uses direct standardisation (Makuch 1982). For the ECOG 0 curve, it takes every patient in the data, sets their ECOG to 0 while keeping their own sex and age, predicts their survival curve from the Cox model, and averages the 226 curves:
\[\widehat S_{\text{ECOG }0}(t) = \frac{1}{n}\sum_{i=1}^{n} \widehat S\bigl(t \mid \text{ECOG } 0,\ \text{sex}_i,\ \text{age}_i\bigr)\]
and the same for ECOG 1 and ECOG 2. The three curves describe the same population (the whole cohort) under three performance statuses, so their differences are due to ECOG alone, as far as the model is right. They are not the curves of the patients who actually had each ECOG; the Kaplan-Meier curves are.
| ECOG | Kaplan-Meier | Adjusted for sex and age |
|---|---|---|
| ECOG 0 | 54% | 55% |
| ECOG 1 | 43% | 41% |
| ECOG 2 | 21% | 24% |
The adjusted and unadjusted curves are close. The ECOG 2 group was older than the others, and adjusting for age moves its curve up only slightly: as the Cox example showed, once ECOG is known age adds little. The difference between the ECOG groups is not explained by age or sex.
When the dashed and solid curves are far apart, the groups differed in the adjustment variables, and the Kaplan-Meier comparison was confounded.