Derive a scenario from data
Simulate ▸ Derive scenario turns a real dataset into a scenario that simulates studies like it: the plasmode idea, without sharing the data.
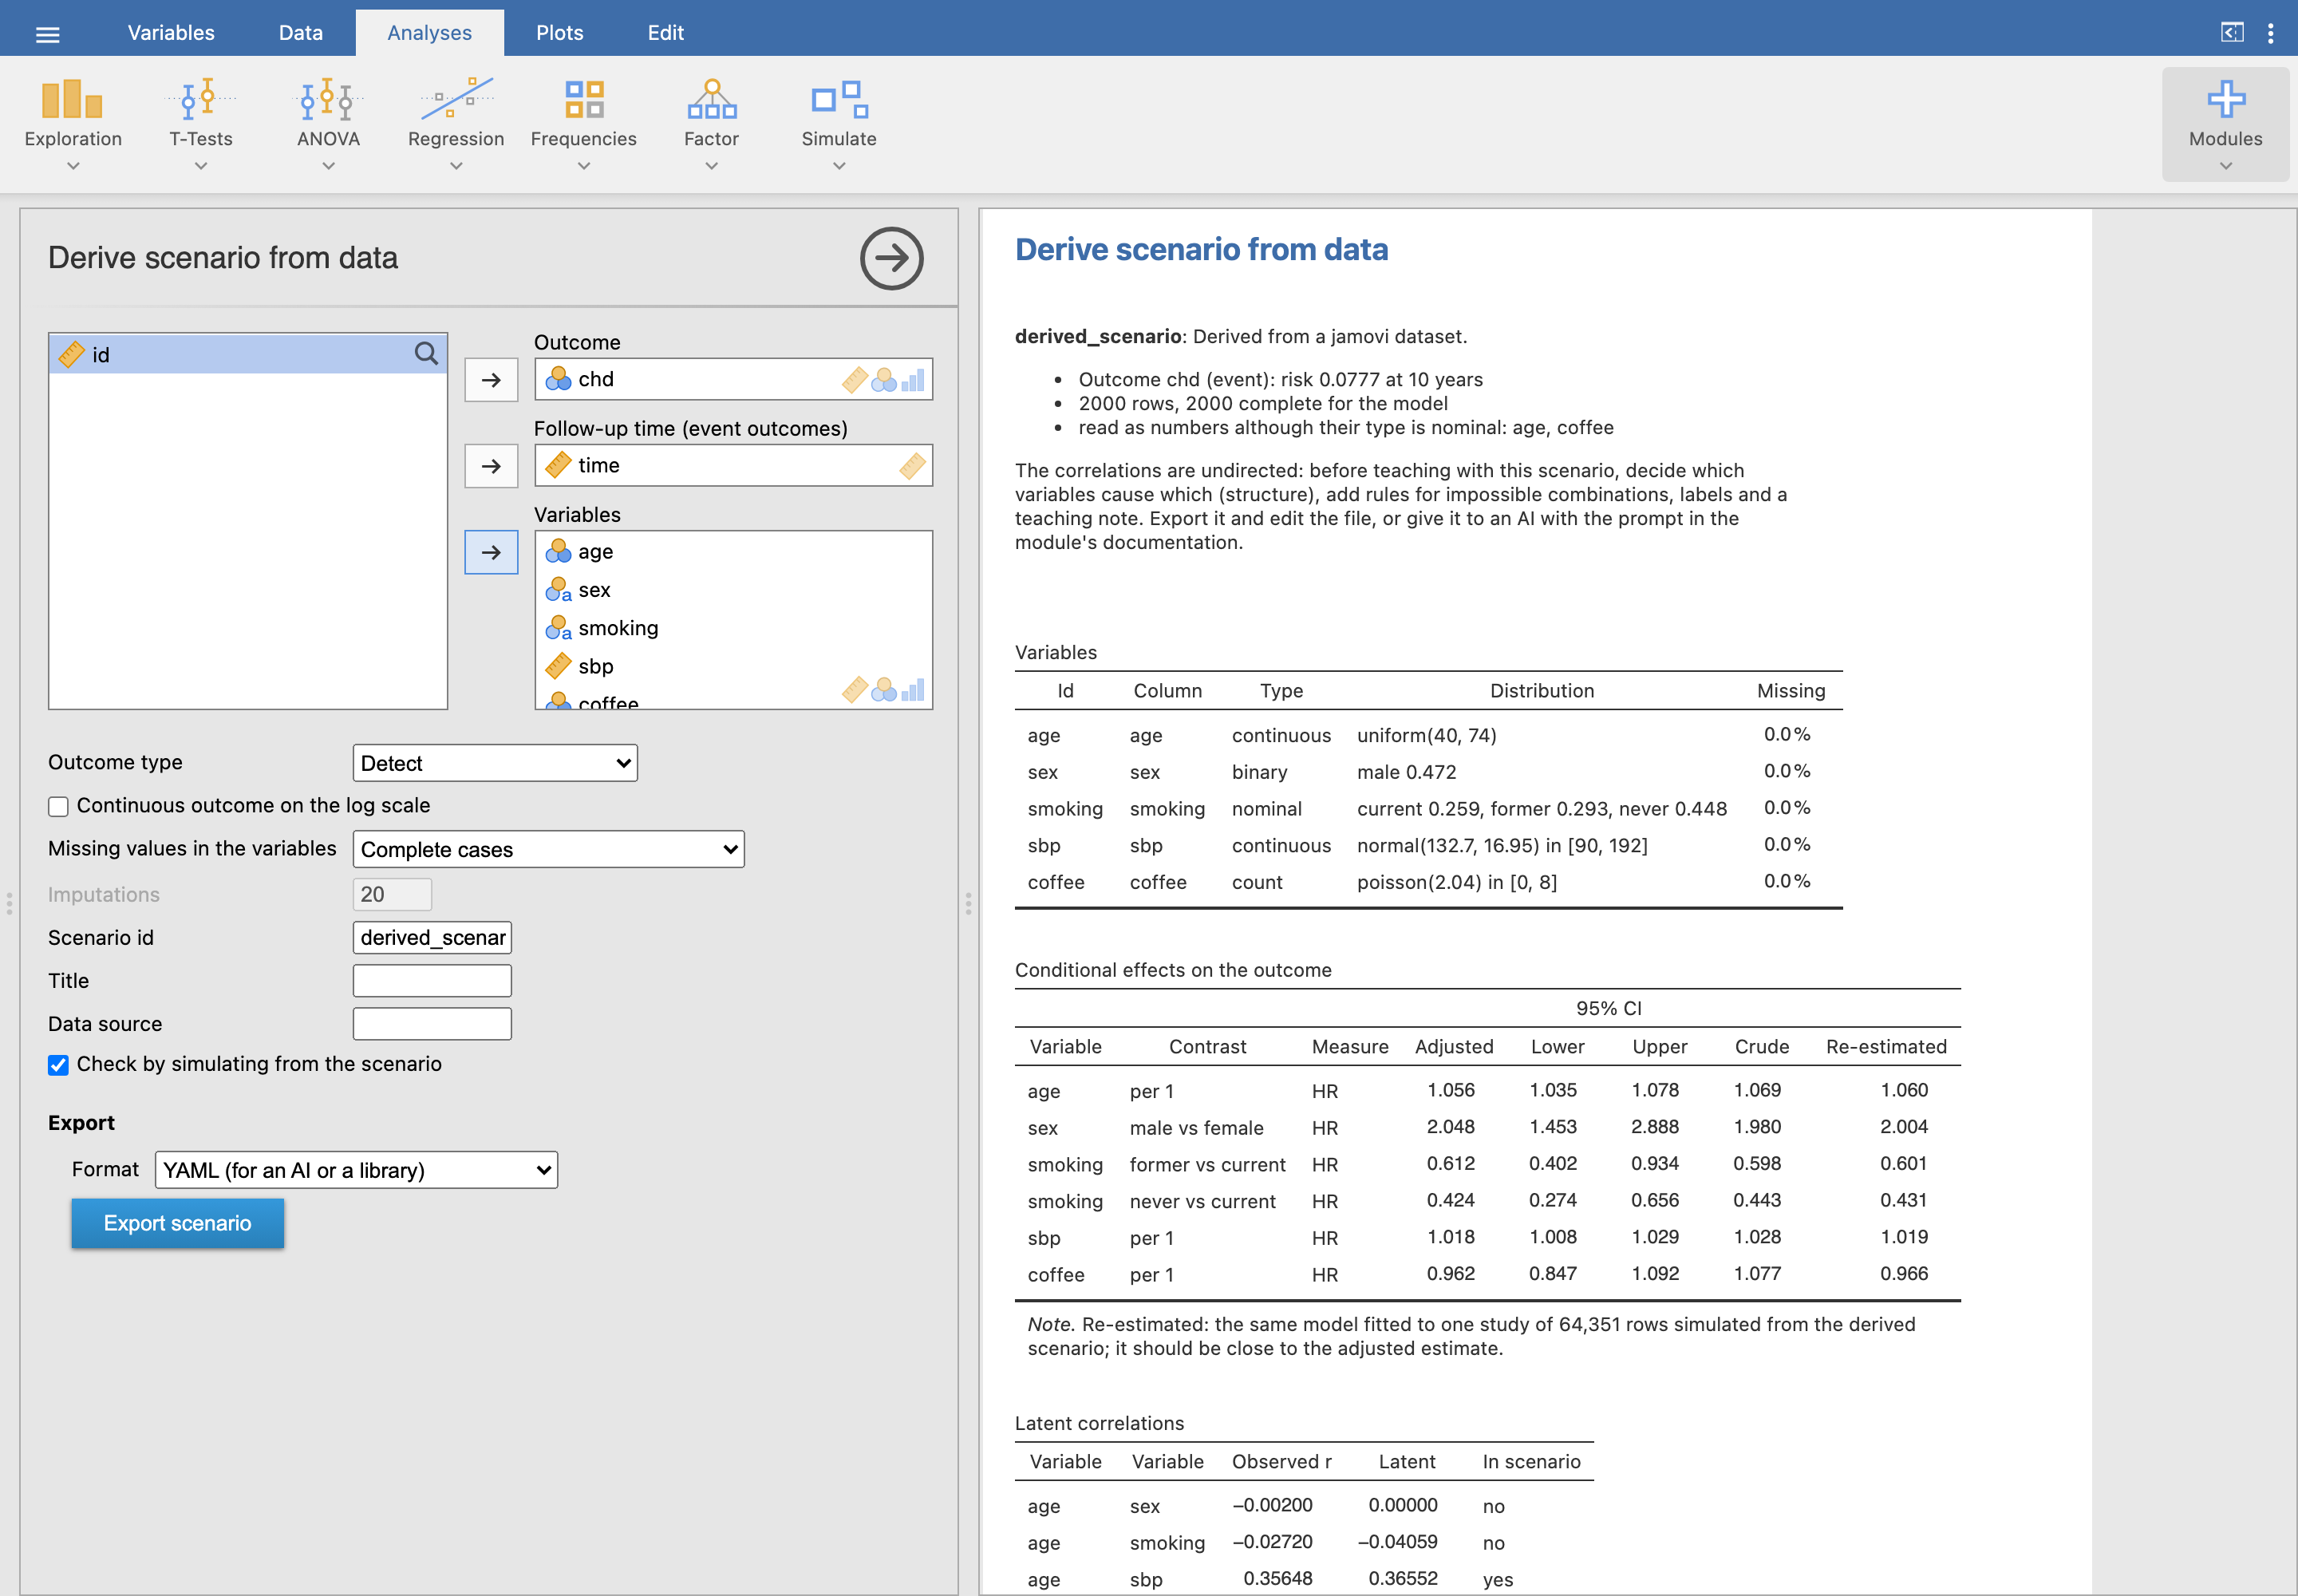
What it estimates
- the marginal distribution of each variable (normal, log-normal, gamma or uniform; Poisson or negative binomial for counts; category proportions);
- the latent correlations, by inverting the Gaussian copula the simulator uses, so a simulated study reproduces the observed correlations;
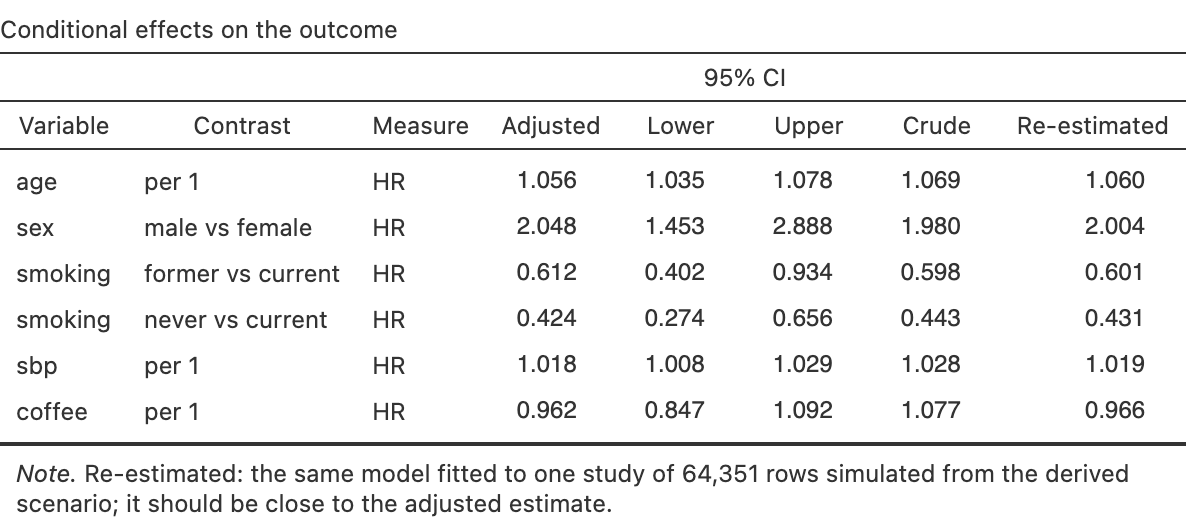
- the conditional effects on the outcome (logistic, linear, Poisson or Cox, with 95% CI and the crude estimate), and the prevalence, mean, risk or Weibull shape that calibrates it.
Check by simulating analyses one large study simulated from the derived scenario with the same model: the Re-estimated column should match the adjusted estimates.
Missing values
Missing values in the variables chooses how the outcome model deals with rows that miss a covariate (the distributions and correlations always use every observed value, and the outcome targets every row with the outcome):
| method | cost | what it gives |
|---|---|---|
| Complete cases | none | unbiased when missingness does not depend on the outcome; loses rows |
| Mean / most frequent value | none | keeps every row, but dilutes the associations and understates the uncertainty |
| Single imputation | low | chained equations (each variable from the others and the outcome, with its noise): unbiased under missing at random, intervals too narrow |
| Multiple imputation | m times higher | m sets, each model on a bootstrap sample, pooled by Rubin’s rules: the reference method |
With an imputation method the table also shows the complete-case estimate. Derive also warns when few rows are complete, when a variable is missing mostly in one outcome group (probably recorded after the outcome), when there are fewer than 10 events per coefficient (with a shrinkage factor), when an effect is not estimable, and when times look like days or months.
Values that do not apply
Real datasets record some variables only for some people: the age at first oral contraceptive use is blank for women who never used them, the years of use are 0, the age at the first smear test is coded 99 when there was none. Before estimating anything, Derive:
- reads an all-nines value at the top of a variable’s range (99, 999), far more frequent than the values just below it, as missing, and so a 0 far below every other value (a blood pressure or a BMI of 0 that meant “not measured”, as in the Pima data);
- finds variables that are missing, or one constant, in a level of another variable and observed elsewhere (structural values). The scenario writes them with
only_if/otherwise(e.g.only_if: co == "sí",otherwise: 0), their distribution comes from the people they apply to, their correlations with that variable are left out (it is a rule), and the model gives the other rows theotherwisevalue, so no rows are lost: the effect of the variable is among those it applies to, and the effect of the other variable is at theotherwisevalue; - reports pairs of numbers whose order the data never break (start age ≤ end age ≤ age): the scenario cannot keep such an order, so write one from the other with a
formulaor leave one out.
Columns that jamovi read as nominal but hold numbers (integers from a CSV) are read as numbers. Try it with chd_sim.csv, a simulated cohort.
Finishing it with an AI
The data cannot tell causes from correlates, so a derived scenario has undirected correlations and raw column names. Export scenario writes it as YAML with a derivation: block (source, original names, missing data, estimates and correlations), which is what an AI needs to finish it:
- A prompt for any AI: attach the exported YAML and
schema.md. It returns the scenario with names and translations, a causal structure, rules for impossible combinations, rounded effects, a teaching note and references marked to verify, plus a report of its decisions. - A Claude skill (also as a zip in the Releases): the same steps, with a validator,
check_scenario.R, that checks the file, simulates a large study and compares the re-estimated effects with the data’s, following renamed variables and changed reference categories.
Review the result before teaching with it: the causal structure is a judgement, and references must be checked.