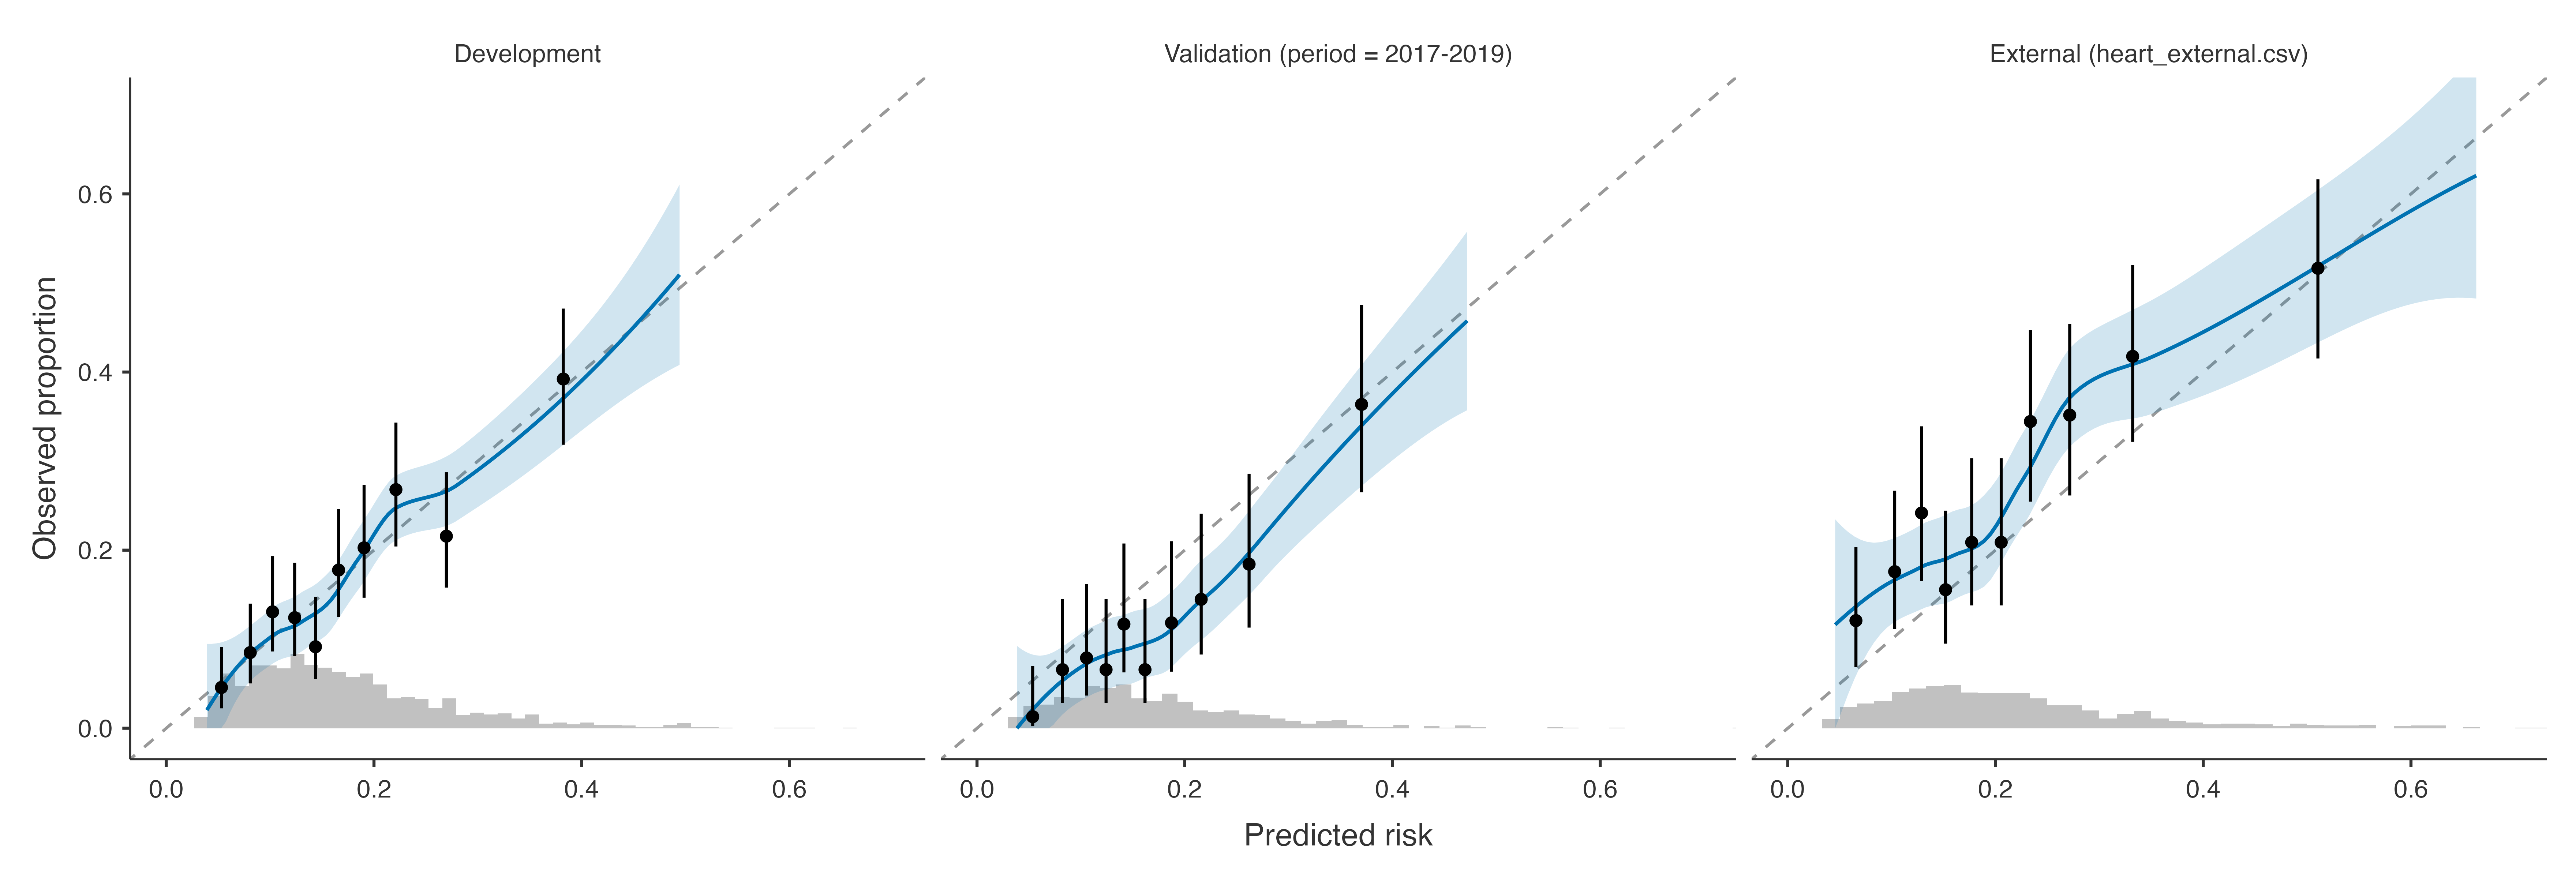
Temporal validation in a later recruitment period and external validation in another population: the variable check, case-mix, performance, calibration and model updating.
Question. The model was developed in patients recruited in 2012–2016. Does it hold for the patients recruited in 2017–2019 (temporal validation)? And in a cohort from another population (external validation)? If its risks are wrong there, can they be fixed without building a new model?
Step 1: the panel
The model of the selection example, without selection (the main effects and the age × sex interaction), and in the Validation box:
Note. Event: event10 = yes. Rows with a missing outcome or predictor are excluded (complete-case analysis).
External Data — Variable Check
Variable
Role
Status
Details
event10
Outcome
OK
sbp
Predictor
OK
2.5% outside the development range [90, 183]
chol
Predictor
OK
0.2% outside the development range [3.2, 10.3]
bmi
Predictor
OK
0.2% outside the development range [17, 40.9]; 8.0% missing
age
Predictor
OK
matched to column 'Age'
sex
Predictor
OK
matched to column 'SEX'
smoking
Predictor
Warning
12 rows with levels not in development (unknown) set to missing; 1.2% missing
diabetes
Predictor
OK
An external file is never in exactly the same format. clinpred matches its columns by name ignoring case (Age, SEX), its factor levels ignoring case (Female), and reports what it could not match: 12 patients with smoking unknown, a level the model does not know, are set to missing; some blood pressures lie outside the range the model was developed on (the model is then extrapolating). Rows with a missing predictor are excluded, as in development.
Step 3: are the populations alike?
Case-mix
Development
Validation (rows)
External
Patients
n
1529
763
908
Events
n (%)
265 (17.3%)
93 (12.2%)
249 (27.4%)
sbp
mean (SD)
120.32 (15.73)
120.04 (15.51)
125.47 (22.64)
chol
mean (SD)
5.50 (1.00)
5.52 (1.01)
5.47 (1.02)
bmi
mean (SD)
27.11 (4.48)
27.02 (4.57)
27.07 (4.40)
age
mean (SD)
60.01 (9.88)
60.19 (9.87)
66.14 (9.76)
sex
female
48.8%
49.0%
49.1%
male
51.2%
51.0%
50.9%
smoking
never
51.1%
48.9%
38.1%
former
29.9%
31.2%
30.4%
current
19.0%
19.9%
31.5%
diabetes
no
91.9%
92.4%
92.2%
yes
8.1%
7.6%
7.8%
Linear predictor
mean (SD)
-1.71 (0.68)
-1.72 (0.67)
-1.42 (0.76)
Membership c-statistic
c
0.544
0.696
Note. Membership c-statistic: how well the predictors and the outcome distinguish validation from development rows (Debray et al. 2015). Near 0.5: similar case-mix (reproducibility); high: different populations (transportability). A larger SD of the linear predictor means a more heterogeneous case-mix, which by itself raises the AUC.
The later period looks like the development data: same distributions, same spread of the linear predictor, and a membership c-statistic of 0.544 — a model can hardly tell the two apart (Debray et al. 2015). Only the event rate is lower. The external cohort is older (mean age 66.14), smokes more and has higher blood pressure; its membership c of 0.696 says it is a different population. Validating there tests transportability, not just reproducibility.
Step 4: performance
Performance in the Validation Data
95% CI
Data set
Measure
Estimate
Lower
Upper
Validation (period = 2017-2019)
Discrimination
C-statistic (AUC)
0.7115
0.6515
0.765
Discrimination slope
0.0802
Calibration
Calibration-in-the-large
-0.4157
-0.6383
-0.193
Calibration slope
1.2592
0.8953
1.623
O/E ratio
0.7150
0.5910
0.865
ICI
0.0504
E50
0.0485
E90
0.0745
Emax
0.0764
Overall
Brier score
0.1009
0.0871
0.115
Scaled Brier score
0.0569
Nagelkerke R²
0.0873
Cox–Snell R²
0.0457
External (heart_external.csv)
Discrimination
C-statistic (AUC)
0.6632
0.6219
0.702
Discrimination slope
0.0776
Calibration
Calibration-in-the-large
0.3384
0.1844
0.492
Calibration slope
0.7968
0.5888
1.005
O/E ratio
1.2580
1.1317
1.398
ICI
0.0551
E50
0.0550
E90
0.0914
Emax
0.1502
Overall
Brier score
0.1880
0.1716
0.204
Scaled Brier score
0.0555
Nagelkerke R²
0.0644
Cox–Snell R²
0.0445
Note. The development model is applied unchanged to the validation data. A calibration-in-the-large far from 0 means the overall risk differs between the populations; a slope below 1, that the predictions are too extreme there.
Later period. Discrimination holds (AUC 0.711), but the model predicts too many events: O/E = 0.71 (0.59–0.86), a calibration-in-the-large of -0.42 on the log-odds scale. Risk factors act the same, but the baseline risk has fallen — typical of temporal validation, and the reason risk calculators are recalibrated periodically.
External cohort. Discrimination falls (AUC 0.663), the model under-predicts (O/E = 1.26) and its predictions are too extreme there (slope 0.80): the effects of the risk factors are weaker in that population.
Step 5: updating
Model Updating in the Validation Data
vs revision
Data set
Method
Parameters
Intercept
Slope
χ²
df
p
Chosen
AUC
Brier
ICI
Validation (period = 2017-2019)
Original model
0
0.0000
1.000
22.49
14
.069
✓
0.711
0.1009
0.05043
Recalibration in the large
1
-0.4157
1.000
7.76
13
.859
0.711
0.0988
0.01442
Recalibration
2
-0.0565
1.259
5.74
12
.929
0.711
0.0984
0.00972
Model revision
14
0.723
0.0976
0.01035
External (heart_external.csv)
Original model
0
0.0000
1.000
41.35
14
< .001
0.663
0.1880
0.05505
Recalibration in the large
1
0.3384
1.000
23.65
13
.035
0.663
0.1852
0.02553
Recalibration
2
0.0855
0.797
20.12
12
.065
✓
0.663
0.1847
0.02106
Model revision
14
0.684
0.1800
0.01260
Note. Recalibration re-estimates the intercept and the slope of the original prediction; intercept and slope: of the original linear predictor (log-odds) in the updated model. Each test compares a method with model revision (likelihood ratio); the closed testing procedure (Vergouwe et al. 2017) keeps the first method, from the original model up, not significantly worse than revision at α = 0.05 (✓). Performance of an updated model is measured in the data used to update it, so it is optimistic, most of all for revision.
For each validation set the table fits the three updating methods and the closed testing procedure (Vergouwe et al. 2017) chooses (✓):
External cohort: the original model and recalibration in the large are significantly worse than revision; recalibration (new intercept 0.09 and slope 0.80) is not, so it is chosen. Two parameters fix most of the miscalibration (ICI from 0.055 to 0.021); re-estimating all 14 coefficients is not needed.
Later period: the procedure keeps the original model, although calibration-in-the-large is clearly off. The first test compares the original model with revision, a 14-parameter change, and is not significant (p = 0.069): the one-parameter shift is diluted among the 14. The closed procedure protects against updating on noise, at the cost of power. Here the O/E ratio and its confidence interval show a real shift that a new intercept corrects (ICI from 0.050 to 0.014); report both and decide with clinical judgement.
The performance of an updated model is measured in the data that updated it, so it is optimistic; a recalibrated model should itself be validated before use.
Debray, Thomas P. A., Yvonne Vergouwe, Hendrik Koffijberg, Daan Nieboer, Ewout W. Steyerberg, and Karel G. M. Moons. 2015. “A New Framework to Enhance the Interpretation of External Validation Studies of Clinical Prediction Models.”Journal of Clinical Epidemiology 68 (3): 279–89. https://doi.org/10.1016/j.jclinepi.2014.06.018.
Vergouwe, Yvonne, Daan Nieboer, Rianne Oostenbrink, et al. 2017. “A Closed Testing Procedure to Select an Appropriate Method for Updating Prediction Models.”Statistics in Medicine 36 (28): 4529–39. https://doi.org/10.1002/sim.7179.